| Player | Player Sort | Pos | Salary | Salary Sort | Pct | Pct Sort | WARP | WARP Sort | WARP/$M | WARP/$M Sort | $/WARP | $/WARP Sort | Current Status |
|---|
 Jeff Bagwell
 |
Bagwell Jeff |
1B |
$16,000,000 |
16000000 |
21.13% |
21.13 |
3.39 |
3.38922 |
0.21 |
0.21182625 |
$4,720,850 |
4720850.2251255 |
|
 Richard Hidalgo
 |
Hidalgo Richard |
RF |
$12,500,000 |
12500000 |
16.51% |
16.51 |
0.62 |
0.620413 |
0.05 |
0.04963304 |
$20,147,869 |
20147869.24194 |
|
 Jeff Kent
 |
Kent Jeff |
2B |
$10,000,000 |
10000000 |
13.21% |
13.21 |
3.48 |
3.47616 |
0.35 |
0.347616 |
$2,876,738 |
2876737.5494799 |
|
 Lance Berkman
 |
Berkman Lance |
RF |
$6,500,000 |
6500000 |
8.58% |
8.58 |
6.91 |
6.90801 |
1.06 |
1.0627707692308 |
$940,937 |
940936.68075177 |
|
 Andy Pettitte
 |
Pettitte Andy |
RP |
$5,500,000 |
5500000 |
7.26% |
7.26 |
2.91 |
2.91165 |
0.53 |
0.52939090909091 |
$1,888,963 |
1888963.3025947 |
|
 Roger Clemens
 |
Clemens Roger |
RP |
$5,000,000 |
5000000 |
6.60% |
6.60 |
6.91 |
6.913 |
1.38 |
1.3826 |
$723,275 |
723274.98915088 |
|
 Wade Miller
 |
Miller Wade |
RP |
$3,400,000 |
3400000 |
4.49% |
4.49 |
0.32 |
0.324815 |
0.10 |
0.095533823529412 |
$10,467,497 |
10467496.882841 |
|
 Roy Oswalt
 |
Oswalt Roy |
RP |
$3,250,000 |
3250000 |
4.29% |
4.29 |
6.86 |
6.85802 |
2.11 |
2.11016 |
$473,898 |
473897.71391743 |
|
 Craig Biggio
 |
Biggio Craig |
LF |
$3,000,000 |
3000000 |
3.96% |
3.96 |
2.09 |
2.08799 |
0.70 |
0.69599666666667 |
$1,436,788 |
1436788.4903663 |
|
 Octavio Dotel
 |
Dotel Octavio |
RP |
$2,800,000 |
2800000 |
3.70% |
3.70 |
1.21 |
1.20726 |
0.43 |
0.43116428571429 |
$2,319,302 |
2319301.558902 |
|
 Jose Vizcaino
 |
Vizcaino Jose |
SS |
$1,200,000 |
1200000 |
1.58% |
1.58 |
0.42 |
0.42104 |
0.35 |
0.35086666666667 |
$2,850,086 |
2850085.5025651 |
|
 Brad Ausmus
 |
Ausmus Brad |
C |
$1,000,000 |
1000000 |
1.32% |
1.32 |
2.25 |
2.24537 |
2.25 |
2.24537 |
$445,361 |
445360.89820386 |
|
 Orlando Palmeiro
 |
Palmeiro Orlando |
PH |
$750,000 |
750000 |
0.99% |
0.99 |
0.06 |
0.0610084 |
0.08 |
0.081344533333333 |
$12,293,389 |
12293389.107074 |
|
 Dan Miceli
 |
Miceli Dan |
RP |
$600,000 |
600000 |
0.79% |
0.79 |
1.97 |
1.96965 |
3.28 |
3.28275 |
$304,623 |
304622.64869393 |
|
 Ricky Stone
 |
Stone Ricky |
RP |
$395,000 |
395000 |
0.52% |
0.52 |
0.07 |
0.0654782 |
0.17 |
0.16576759493671 |
$6,032,542 |
6032542.1285252 |
|
 Tim Redding
 |
Redding Tim |
RP |
$395,000 |
395000 |
0.52% |
0.52 |
-1.09 |
-1.08739 |
— |
0 |
— |
0 |
|
 Brandon Duckworth
 |
Duckworth Brandon |
RP |
$390,000 |
390000 |
0.52% |
0.52 |
-0.16 |
-0.16423 |
— |
0 |
— |
0 |
|
 Morgan Ensberg
 |
Ensberg Morgan |
3B |
$380,000 |
380000 |
0.50% |
0.50 |
1.36 |
1.36056 |
3.58 |
3.5804210526316 |
$279,297 |
279296.76015758 |
|
 Adam Everett
 |
Everett Adam |
SS |
$370,000 |
370000 |
0.49% |
0.49 |
2.62 |
2.62282 |
7.09 |
7.0887027027027 |
$141,070 |
141069.5358431 |
|
 Brad Lidge
 |
Lidge Brad |
RP |
$360,000 |
360000 |
0.48% |
0.48 |
3.85 |
3.84987 |
10.69 |
10.694083333333 |
$93,510 |
93509.650975228 |
|
 Mike Lamb
 |
Lamb Mike |
3B |
$352,000 |
352000 |
0.46% |
0.46 |
2.33 |
2.33271 |
6.63 |
6.6270170454545 |
$150,897 |
150897.45403415 |
|
 Brandon Lyon
 |
Lyon Brandon |
DNP |
$330,000 |
330000 |
0.44% |
0.44 |
— |
0.00 |
— |
0 |
— |
0 |
|
 Jared Fernandez
 |
Fernandez Jared |
RP |
$325,000 |
325000 |
0.43% |
0.43 |
-0.03 |
-0.0323071 |
— |
0 |
— |
0 |
|
 Raul Chavez
 |
Chavez Raul |
C |
$315,000 |
315000 |
0.42% |
0.42 |
-1.00 |
-1.00374 |
— |
0 |
— |
0 |
|
 Jason Lane
 |
Lane Jason |
PH |
$307,500 |
307500 |
0.41% |
0.41 |
0.69 |
0.691391 |
2.25 |
2.2484260162602 |
$444,756 |
444755.57246189 |
|
 Eric Bruntlett
 |
Bruntlett Eric |
SS |
$307,500 |
307500 |
0.41% |
0.41 |
0.37 |
0.365097 |
1.19 |
1.1873073170732 |
$842,242 |
842241.92474877 |
|
| Year | Astros payroll |
PR Sort |
Avg payroll |
AvgPR Sort |
Diff |
Diff Sort |
|---|
| 1989 | $78,000 | 78000 | $763,625 | 763625 | $-685,625 | -685625 |
| 1990 | $240,000 | 240000 | $1,203,571 | 1203571 | $-963,571 | -963571 |
| 1991 | $437,500 | 437500 | $1,884,642 | 1884642 | $-1,447,142 | -1447142 |
| 1992 | $1,375,000 | 1375000 | $2,356,071 | 2356071 | $-981,071 | -981071 |
| 1993 | $3,050,000 | 3050000 | $3,410,000 | 3410000 | $-360,000 | -360000 |
| 1994 | $3,375,000 | 3375000 | $3,447,916 | 3447916 | $-72,916 | -72916 |
| 1995 | $4,600,000 | 4600000 | $4,591,041 | 4591041 | $8,959 | 8959 |
| 1996 | $2,000,000 | 2000000 | $4,109,148 | 4109148 | $-2,109,148 | -2109148 |
| 1997 | $6,180,000 | 6180000 | $4,753,000 | 4753000 | $1,427,000 | 1427000 |
| 1998 | $6,120,000 | 6120000 | $6,661,904 | 6661904 | $-541,904 | -541904 |
| 1999 | $6,060,000 | 6060000 | $7,867,823 | 7867823 | $-1,807,823 | -1807823 |
| 2000 | $51,806,667 | 51806667 | $55,368,142 | 55368142 | $-3,561,475 | -3561475 |
| 2001 | $59,632,667 | 59632667 | $64,937,084 | 64937084 | $-5,304,417 | -5304417 |
| 2002 | $65,156,750 | 65156750 | $67,238,672 | 67238672 | $-2,081,922 | -2081922 |
| 2003 | $71,040,000 | 71040000 | $70,654,480 | 70654480 | $385,520 | 385520 |
| 2004 | $75,727,000 | 75727000 | $69,466,729 | 69466729 | $6,260,271 | 6260271 |
| 2005 | $78,786,000 | 78786000 | $74,114,841 | 74114841 | $4,671,159 | 4671159 |
| 2006 | $95,998,000 | 95998000 | $79,621,815 | 79621815 | $16,376,185 | 16376185 |
| 2007 | $90,230,500 | 90230500 | $85,537,470 | 85537470 | $4,693,030 | 4693030 |
| 2008 | $96,369,000 | 96369000 | $92,003,799 | 92003799 | $4,365,201 | 4365201 |
| 2009 | $103,590,000 | 103590000 | $92,169,598 | 92169598 | $11,420,402 | 11420402 |
| 2010 | $91,605,500 | 91605500 | $94,342,601 | 94342601 | $-2,737,101 | -2737101 |
| 2011 | $77,694,000 | 77694000 | $96,974,710 | 96974710 | $-19,280,710 | -19280710 |
| 2012 | $60,799,000 | 60799000 | $100,947,217 | 100947217 | $-40,148,217 | -40148217 |
| 2013 | $26,105,600 | 26105600 | $108,586,966 | 108586966 | $-82,481,366 | -82481366 |
| 2014 | $51,985,800 | 51985800 | $117,131,361 | 117131361 | $-65,145,561 | -65145561 |
| 2015 | $72,464,200 | 72464200 | $126,168,161 | 126168161 | $-53,703,961 | -53703961 |
| 2016 | $98,793,700 | 98793700 | $131,756,569 | 131756569 | $-32,962,869 | -32962869 |
| 2017 | $124,343,900 | 124343900 | $136,337,445 | 136337445 | $-11,993,545 | -11993545 |
| 2018 | $160,393,900 | 160393900 | $135,360,600 | 135360600 | $25,033,300 | 25033300 |
| 2019 | $158,043,000 | 158043000 | $134,792,134 | 134792134 | $23,250,866 | 23250866 |
| 2020 | $210,899,457 | 210899457 | $139,496,467 | 139496467 | $71,402,990 | 71402990 |
| 2021 | $187,448,657 | 187448657 | $130,712,288 | 130712288 | $56,736,369 | 56736369 |
| 2022 | $173,879,000 | 173879000 | $149,802,695 | 149802695 | $24,076,305 | 24076305 |
| 2023 | $190,917,233 | 190917233 | $161,692,345 | 161692345 | $29,224,888 | 29224888 |
| 2024 | $176,933,333 | 176933333 | $136,306,249 | 136306249 | $40,627,084 | 40627084 |
| 2025 | $101,933,333 | 101933333 | $98,329,527 | 98329527 | $3,603,806 | 3603806 |
| 2026 | $84,933,333 | 84933333 | $78,039,273 | 78039273 | $6,894,060 | 6894060 |
| 2027 | $67,233,333 | 67233333 | $60,919,343 | 60919343 | $6,313,990 | 6313990 |
| 2028 | $45,833,333 | 45833333 | $46,901,712 | 46901712 | $-1,068,379 | -1068379 |
|
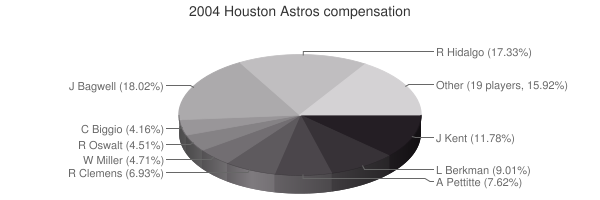
 2004 Houston Astros