| Player | Player Sort | Pos | Salary | Salary Sort | Pct | Pct Sort | WARP | WARP Sort | WARP/$M | WARP/$M Sort | $/WARP | $/WARP Sort | Current Status |
|---|
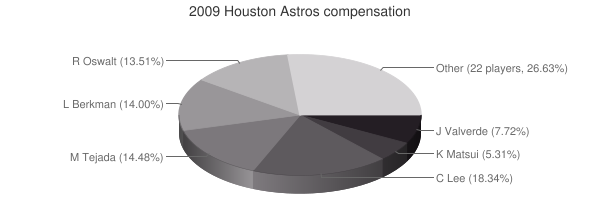
 Carlos Lee
 |
Lee Carlos |
LF |
$19,000,000 |
19000000 |
18.34% |
18.34 |
1.27 |
1.26964 |
0.07 |
0.066823157894737 |
$14,964,872 |
14964871.932201 |
|
 Miguel Tejada
 |
Tejada Miguel |
SS |
$15,000,000 |
15000000 |
14.48% |
14.48 |
4.28 |
4.27798 |
0.29 |
0.28519866666667 |
$3,506,328 |
3506327.7528179 |
|
 Lance Berkman
 |
Berkman Lance |
1B |
$14,500,000 |
14500000 |
14.00% |
14.00 |
4.72 |
4.71553 |
0.33 |
0.32520896551724 |
$3,074,946 |
3074945.9763802 |
|
 Roy Oswalt
 |
Oswalt Roy |
RP |
$14,000,000 |
14000000 |
13.51% |
13.51 |
4.30 |
4.2999 |
0.31 |
0.30713571428571 |
$3,255,890 |
3255889.6718528 |
|
 Jose Valverde
 |
Valverde Jose |
RP |
$8,000,000 |
8000000 |
7.72% |
7.72 |
0.89 |
0.888847 |
0.11 |
0.111105875 |
$9,000,424 |
9000424.1449878 |
|
 Kazuo Matsui
 |
Matsui Kazuo |
2B |
$5,500,000 |
5500000 |
5.31% |
5.31 |
1.02 |
1.02431 |
0.19 |
0.18623818181818 |
$5,369,468 |
5369468.2273921 |
|
 LaTroy Hawkins
 |
Hawkins LaTroy |
RP |
$3,500,000 |
3500000 |
3.38% |
3.38 |
0.56 |
0.558019 |
0.16 |
0.159434 |
$6,272,188 |
6272187.8645709 |
|
 Wandy Rodriguez
 |
Rodriguez Wandy |
RP |
$2,600,000 |
2600000 |
2.51% |
2.51 |
4.10 |
4.10425 |
1.58 |
1.5785576923077 |
$633,490 |
633489.67533654 |
|
 Doug Brocail
 |
Brocail Doug |
RP |
$2,500,000 |
2500000 |
2.41% |
2.41 |
-0.31 |
-0.312695 |
— |
0 |
— |
0 |
|
 Brian Moehler
 |
Moehler Brian |
RP |
$2,300,000 |
2300000 |
2.22% |
2.22 |
0.15 |
0.151834 |
0.07 |
0.066014782608696 |
$15,148,122 |
15148122.29145 |
|
 Mike Hampton
 |
Hampton Mike |
RP |
$2,000,000 |
2000000 |
1.93% |
1.93 |
0.70 |
0.702854 |
0.35 |
0.351427 |
$2,845,541 |
2845541.1792492 |
|
 Darin Erstad
 |
Erstad Darin |
PH |
$1,750,000 |
1750000 |
1.69% |
1.69 |
-0.74 |
-0.739628 |
— |
0 |
— |
0 |
|
 Geoff Geary
 |
Geary Geoff |
RP |
$1,700,000 |
1700000 |
1.64% |
1.64 |
0.01 |
0.00948904 |
0.01 |
0.0055817882352941 |
$179,154,056 |
179154055.62628 |
FA/2011 |
 Brandon Backe
 |
Backe Brandon |
RP |
$1,550,000 |
1550000 |
1.50% |
1.50 |
-0.25 |
-0.25317 |
— |
0 |
— |
0 |
|
 Ivan Rodriguez
 |
Rodriguez Ivan |
C |
$1,500,000 |
1500000 |
1.45% |
1.45 |
0.38 |
0.377491 |
0.25 |
0.25166066666667 |
$3,973,605 |
3973604.6687206 |
|
 Geoff Blum
 |
Blum Geoff |
3B |
$1,250,000 |
1250000 |
1.21% |
1.21 |
-0.34 |
-0.33639 |
— |
0 |
— |
0 |
|
 Tim Byrdak
 |
Byrdak Tim |
RP |
$1,000,000 |
1000000 |
0.97% |
0.97 |
-0.02 |
-0.023816 |
— |
0 |
— |
0 |
|
 Russ Ortiz
 |
Ortiz Russ |
RP |
$750,000 |
750000 |
0.72% |
0.72 |
0.42 |
0.420691 |
0.56 |
0.56092133333333 |
$1,782,781 |
1782781.1861913 |
|
 Jason Michaels
 |
Michaels Jason |
PH |
$750,000 |
750000 |
0.72% |
0.72 |
0.09 |
0.0850704 |
0.11 |
0.1134272 |
$8,816,228 |
8816227.5009874 |
|
 Aaron Boone
 |
Boone Aaron |
PH |
$750,000 |
750000 |
0.72% |
0.72 |
-0.37 |
-0.370539 |
— |
0 |
— |
0 |
|
 Humberto Quintero
 |
Quintero Humberto |
C |
$610,000 |
610000 |
0.59% |
0.59 |
0.40 |
0.396196 |
0.65 |
0.64950163934426 |
$1,539,642 |
1539641.995376 |
|
 Jason Smith
 |
Smith Jason |
PH |
$500,000 |
500000 |
0.48% |
0.48 |
-0.70 |
-0.701629 |
— |
0 |
— |
0 |
|
 Chris Sampson
 |
Sampson Chris |
RP |
$449,000 |
449000 |
0.43% |
0.43 |
0.31 |
0.314946 |
0.70 |
0.70143875278396 |
$1,425,641 |
1425641.2210347 |
Arb2/2011, Arb3/2012, FA/2013 |
 Hunter Pence
 |
Pence Hunter |
RF |
$439,000 |
439000 |
0.42% |
0.42 |
3.87 |
3.86956 |
8.81 |
8.8144874715262 |
$113,450 |
113449.59116799 |
|
 Michael Bourn
 |
Bourn Michael |
CF |
$434,500 |
434500 |
0.42% |
0.42 |
4.33 |
4.33274 |
9.97 |
9.9717836593786 |
$100,283 |
100282.96182093 |
|
 Jeff Keppinger
 |
Keppinger Jeff |
3B |
$427,500 |
427500 |
0.41% |
0.41 |
-0.11 |
-0.11385 |
— |
0 |
— |
0 |
|
 Wesley Wright
 |
Wright Wesley |
RP |
$425,000 |
425000 |
0.41% |
0.41 |
0.47 |
0.469975 |
1.11 |
1.1058235294118 |
$904,303 |
904303.4203947 |
|
 Shane Loux
 |
Loux Shane |
DNP |
$405,000 |
405000 |
0.39% |
0.39 |
— |
0.00 |
— |
0 |
— |
0 |
|
| Year | Astros payroll |
PR Sort |
Avg payroll |
AvgPR Sort |
Diff |
Diff Sort |
|---|
| 1989 | $78,000 | 78000 | $862,714 | 862714 | $-784,714 | -784714 |
| 1990 | $240,000 | 240000 | $1,203,571 | 1203571 | $-963,571 | -963571 |
| 1991 | $437,500 | 437500 | $1,884,642 | 1884642 | $-1,447,142 | -1447142 |
| 1992 | $1,375,000 | 1375000 | $2,356,071 | 2356071 | $-981,071 | -981071 |
| 1993 | $3,050,000 | 3050000 | $3,410,000 | 3410000 | $-360,000 | -360000 |
| 1994 | $3,375,000 | 3375000 | $3,911,904 | 3911904 | $-536,904 | -536904 |
| 1995 | $4,600,000 | 4600000 | $5,208,333 | 5208333 | $-608,333 | -608333 |
| 1996 | $2,000,000 | 2000000 | $4,583,416 | 4583416 | $-2,583,416 | -2583416 |
| 1997 | $6,180,000 | 6180000 | $4,892,222 | 4892222 | $1,287,778 | 1287778 |
| 1998 | $6,120,000 | 6120000 | $6,661,904 | 6661904 | $-541,904 | -541904 |
| 1999 | $6,060,000 | 6060000 | $7,867,823 | 7867823 | $-1,807,823 | -1807823 |
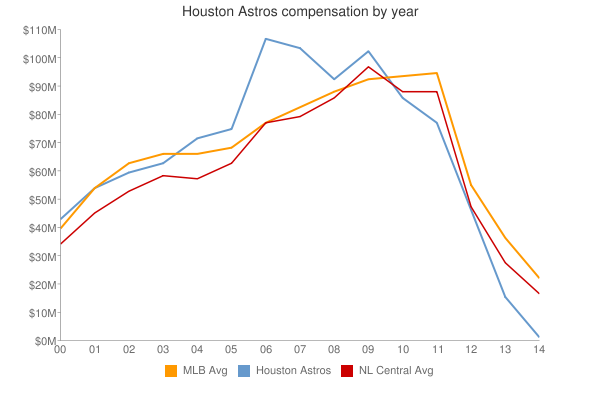
| 2000 | $51,806,667 | 51806667 | $56,164,089 | 56164089 | $-4,357,422 | -4357422 |
| 2001 | $59,632,667 | 59632667 | $65,991,638 | 65991638 | $-6,358,971 | -6358971 |
| 2002 | $65,156,750 | 65156750 | $68,244,471 | 68244471 | $-3,087,721 | -3087721 |
| 2003 | $71,040,000 | 71040000 | $71,318,479 | 71318479 | $-278,479 | -278479 |
| 2004 | $75,727,000 | 75727000 | $70,466,961 | 70466961 | $5,260,039 | 5260039 |
| 2005 | $78,786,000 | 78786000 | $73,264,780 | 73264780 | $5,521,220 | 5521220 |
| 2006 | $95,998,000 | 95998000 | $79,051,754 | 79051754 | $16,946,246 | 16946246 |
| 2007 | $90,230,500 | 90230500 | $83,931,138 | 83931138 | $6,299,362 | 6299362 |
| 2008 | $96,369,000 | 96369000 | $90,812,373 | 90812373 | $5,556,627 | 5556627 |
| 2009 | $103,590,000 | 103590000 | $91,093,211 | 91093211 | $12,496,789 | 12496789 |
| 2010 | $91,605,500 | 91605500 | $93,373,681 | 93373681 | $-1,768,181 | -1768181 |
| 2011 | $77,694,000 | 77694000 | $96,102,034 | 96102034 | $-18,408,034 | -18408034 |
| 2012 | $60,799,000 | 60799000 | $100,657,138 | 100657138 | $-39,858,138 | -39858138 |
| 2013 | $26,105,600 | 26105600 | $109,024,990 | 109024990 | $-82,919,390 | -82919390 |
| 2014 | $51,985,800 | 51985800 | $117,828,782 | 117828782 | $-65,842,982 | -65842982 |
| 2015 | $72,464,200 | 72464200 | $127,404,244 | 127404244 | $-54,940,044 | -54940044 |
| 2016 | $98,793,700 | 98793700 | $132,219,407 | 132219407 | $-33,425,707 | -33425707 |
| 2017 | $124,343,900 | 124343900 | $137,302,894 | 137302894 | $-12,958,994 | -12958994 |
| 2018 | $160,393,900 | 160393900 | $136,929,168 | 136929168 | $23,464,732 | 23464732 |
| 2019 | $158,043,000 | 158043000 | $136,944,257 | 136944257 | $21,098,743 | 21098743 |
| 2020 | $210,899,457 | 210899457 | $140,677,788 | 140677788 | $70,221,669 | 70221669 |
| 2021 | $187,448,657 | 187448657 | $132,162,631 | 132162631 | $55,286,026 | 55286026 |
| 2022 | $173,879,000 | 173879000 | $149,374,046 | 149374046 | $24,504,954 | 24504954 |
| 2023 | $190,917,233 | 190917233 | $160,460,390 | 160460390 | $30,456,843 | 30456843 |
| 2024 | $176,933,333 | 176933333 | $135,504,022 | 135504022 | $41,429,311 | 41429311 |
| 2025 | $101,933,333 | 101933333 | $96,417,302 | 96417302 | $5,516,031 | 5516031 |
| 2026 | $84,933,333 | 84933333 | $76,694,120 | 76694120 | $8,239,213 | 8239213 |
| 2027 | $67,233,333 | 67233333 | $58,935,617 | 58935617 | $8,297,716 | 8297716 |
| 2028 | $45,833,333 | 45833333 | $45,437,759 | 45437759 | $395,574 | 395574 |
|
 2009 Houston Astros