| Player | Player Sort | Pos | Salary | Salary Sort | Pct | Pct Sort | WARP | WARP Sort | WARP/$M | WARP/$M Sort | $/WARP | $/WARP Sort | Current Status |
|---|
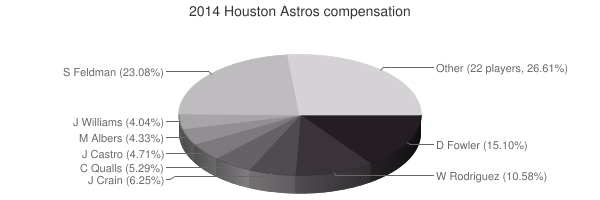
 Scott Feldman
 |
Feldman Scott |
RP |
$12,000,000 |
12000000 |
23.08% |
23.08 |
0.07 |
0.0660686 |
0.01 |
0.0055057166666667 |
$181,629,397 |
181629397.32339 |
|
 Dexter Fowler
 |
Fowler Dexter |
CF |
$7,850,000 |
7850000 |
15.10% |
15.10 |
1.65 |
1.6457 |
0.21 |
0.20964331210191 |
$4,770,007 |
4770006.6840858 |
|
 Wandy Rodriguez
 |
Rodriguez Wandy |
DNP |
$5,500,000 |
5500000 |
10.58% |
10.58 |
— |
0.00 |
— |
0 |
— |
0 |
|
 Jesse Crain
 |
Crain Jesse |
DNP |
$3,250,000 |
3250000 |
6.25% |
6.25 |
— |
0.00 |
— |
0 |
— |
0 |
|
 Chad Qualls
 |
Qualls Chad |
RP |
$2,750,000 |
2750000 |
5.29% |
5.29 |
0.79 |
0.793638 |
0.29 |
0.28859563636364 |
$3,465,056 |
3465055.8567004 |
|
 Jason Castro
 |
Castro Jason |
C |
$2,450,000 |
2450000 |
4.71% |
4.71 |
2.65 |
2.64563 |
1.08 |
1.0798489795918 |
$926,055 |
926055.4196921 |
|
 Matt Albers
 |
Albers Matt |
RP |
$2,250,000 |
2250000 |
4.33% |
4.33 |
-0.18 |
-0.181096 |
— |
0 |
— |
0 |
|
 Jerome Williams
 |
Williams Jerome |
RP |
$2,100,000 |
2100000 |
4.04% |
4.04 |
-0.01 |
-0.00739447 |
— |
0 |
— |
0 |
|
 Jon Singleton
 |
Singleton Jon |
1B |
$1,500,000 |
1500000 |
2.89% |
2.89 |
-0.12 |
-0.115242 |
— |
0 |
— |
0 |
|
 Jose Altuve
 |
Altuve Jose |
2B |
$1,437,500 |
1437500 |
2.77% |
2.77 |
5.13 |
5.13276 |
3.57 |
3.5706156521739 |
$280,064 |
280063.74737958 |
|
 Jesus Guzman
 |
Guzman Jesus |
1B |
$1,300,000 |
1300000 |
2.50% |
2.50 |
-1.08 |
-1.07644 |
— |
0 |
— |
0 |
|
 Alex Presley
 |
Presley Alex |
LF |
$511,500 |
511500 |
0.98% |
0.98 |
-0.50 |
-0.501902 |
— |
0 |
— |
0 |
|
 Matt Dominguez
 |
Dominguez Matt |
3B |
$510,100 |
510100 |
0.98% |
0.98 |
-1.32 |
-1.31822 |
— |
0 |
— |
0 |
|
 Chris Carter
 |
Carter Chris |
DH |
$510,000 |
510000 |
0.98% |
0.98 |
2.83 |
2.82969 |
5.55 |
5.5484117647059 |
$180,232 |
180231.75683555 |
|
 Lucas Harrell
 |
Harrell Lucas |
RP |
$509,700 |
509700 |
0.98% |
0.98 |
-0.47 |
-0.473312 |
— |
0 |
— |
0 |
|
 Dallas Keuchel
 |
Keuchel Dallas |
RP |
$508,700 |
508700 |
0.98% |
0.98 |
4.78 |
4.78046 |
9.40 |
9.3974051503833 |
$106,412 |
106412.35362287 |
|
 Josh Fields
 |
Fields Josh |
RP |
$506,500 |
506500 |
0.97% |
0.97 |
-0.63 |
-0.631057 |
— |
0 |
— |
0 |
|
 Carlos Corporán
 |
Corporan Carlos |
C |
$505,300 |
505300 |
0.97% |
0.97 |
1.27 |
1.27367 |
2.52 |
2.520621413022 |
$396,728 |
396727.56679517 |
|
 Anthony Bass
 |
Bass Anthony |
RP |
$505,200 |
505200 |
0.97% |
0.97 |
-0.40 |
-0.396678 |
— |
0 |
— |
0 |
|
 Robbie Grossman
 |
Grossman Robbie |
LF |
$504,500 |
504500 |
0.97% |
0.97 |
0.10 |
0.100711 |
0.20 |
0.1996253716551 |
$5,009,383 |
5009383.2848448 |
|
 Marwin Gonzalez
 |
Gonzalez Marwin |
SS |
$504,500 |
504500 |
0.97% |
0.97 |
1.45 |
1.44686 |
2.87 |
2.8679088206145 |
$348,686 |
348686.12028807 |
|
 Brad Peacock
 |
Peacock Brad |
RP |
$504,300 |
504300 |
0.97% |
0.97 |
-2.83 |
-2.82727 |
— |
0 |
— |
0 |
|
 Jonathan Villar
 |
Villar Jonathan |
SS |
$503,800 |
503800 |
0.97% |
0.97 |
1.26 |
1.25564 |
2.49 |
2.4923382294561 |
$401,230 |
401229.65181103 |
|
 Brett Oberholtzer
 |
Oberholtzer Brett |
RP |
$503,600 |
503600 |
0.97% |
0.97 |
-0.41 |
-0.40699 |
— |
0 |
— |
0 |
|
 Kevin Chapman
 |
Chapman Kevin |
RP |
$503,400 |
503400 |
0.97% |
0.97 |
-0.26 |
-0.261133 |
— |
0 |
— |
0 |
|
 L.J. Hoes
 |
Hoes L.J. |
LF |
$502,900 |
502900 |
0.97% |
0.97 |
-0.65 |
-0.651968 |
— |
0 |
— |
0 |
|
 Marc Krauss
 |
Krauss Marc |
1B |
$502,300 |
502300 |
0.97% |
0.97 |
-0.70 |
-0.70056 |
— |
0 |
— |
0 |
|
 Alex White
 |
White Alex |
DNP |
$502,000 |
502000 |
0.97% |
0.97 |
— |
0.00 |
— |
0 |
— |
0 |
|
 Jarred Cosart
 |
Cosart Jarred |
RP |
$500,000 |
500000 |
0.96% |
0.96 |
0.80 |
0.804362 |
1.61 |
1.608724 |
$621,611 |
621610.66783364 |
|
 Asher Wojciechowski
 |
Wojciechowski Asher |
DNP |
$500,000 |
500000 |
0.96% |
0.96 |
— |
0.00 |
— |
0 |
— |
0 |
|
| Year | Astros payroll |
PR Sort |
Avg payroll |
AvgPR Sort |
Diff |
Diff Sort |
|---|
| 1989 | $78,000 | 78000 | $862,714 | 862714 | $-784,714 | -784714 |
| 1990 | $240,000 | 240000 | $1,203,571 | 1203571 | $-963,571 | -963571 |
| 1991 | $437,500 | 437500 | $1,884,642 | 1884642 | $-1,447,142 | -1447142 |
| 1992 | $1,375,000 | 1375000 | $2,356,071 | 2356071 | $-981,071 | -981071 |
| 1993 | $3,050,000 | 3050000 | $3,410,000 | 3410000 | $-360,000 | -360000 |
| 1994 | $3,375,000 | 3375000 | $3,911,904 | 3911904 | $-536,904 | -536904 |
| 1995 | $4,600,000 | 4600000 | $5,208,333 | 5208333 | $-608,333 | -608333 |
| 1996 | $2,000,000 | 2000000 | $4,583,416 | 4583416 | $-2,583,416 | -2583416 |
| 1997 | $6,180,000 | 6180000 | $4,892,222 | 4892222 | $1,287,778 | 1287778 |
| 1998 | $6,120,000 | 6120000 | $6,661,904 | 6661904 | $-541,904 | -541904 |
| 1999 | $6,060,000 | 6060000 | $7,867,823 | 7867823 | $-1,807,823 | -1807823 |
| 2000 | $51,806,667 | 51806667 | $57,491,092 | 57491092 | $-5,684,425 | -5684425 |
| 2001 | $59,632,667 | 59632667 | $67,120,750 | 67120750 | $-7,488,083 | -7488083 |
| 2002 | $65,156,750 | 65156750 | $69,204,705 | 69204705 | $-4,047,955 | -4047955 |
| 2003 | $71,040,000 | 71040000 | $72,156,639 | 72156639 | $-1,116,639 | -1116639 |
| 2004 | $75,727,000 | 75727000 | $71,426,357 | 71426357 | $4,300,643 | 4300643 |
| 2005 | $78,786,000 | 78786000 | $73,628,169 | 73628169 | $5,157,831 | 5157831 |
| 2006 | $95,998,000 | 95998000 | $81,192,832 | 81192832 | $14,805,168 | 14805168 |
| 2007 | $90,230,500 | 90230500 | $85,747,487 | 85747487 | $4,483,013 | 4483013 |
| 2008 | $96,369,000 | 96369000 | $93,079,041 | 93079041 | $3,289,959 | 3289959 |
| 2009 | $103,590,000 | 103590000 | $92,957,049 | 92957049 | $10,632,951 | 10632951 |
| 2010 | $91,605,500 | 91605500 | $94,957,956 | 94957956 | $-3,352,456 | -3352456 |
| 2011 | $77,694,000 | 77694000 | $97,426,414 | 97426414 | $-19,732,414 | -19732414 |
| 2012 | $60,799,000 | 60799000 | $100,689,500 | 100689500 | $-39,890,500 | -39890500 |
| 2013 | $26,105,600 | 26105600 | $106,658,387 | 106658387 | $-80,552,787 | -80552787 |
| 2014 | $51,985,800 | 51985800 | $115,428,670 | 115428670 | $-63,442,870 | -63442870 |
| 2015 | $72,464,200 | 72464200 | $125,458,486 | 125458486 | $-52,994,286 | -52994286 |
| 2016 | $98,793,700 | 98793700 | $130,290,910 | 130290910 | $-31,497,210 | -31497210 |
| 2017 | $124,343,900 | 124343900 | $136,573,000 | 136573000 | $-12,229,100 | -12229100 |
| 2018 | $160,393,900 | 160393900 | $135,681,867 | 135681867 | $24,712,033 | 24712033 |
| 2019 | $158,043,000 | 158043000 | $134,776,225 | 134776225 | $23,266,775 | 23266775 |
| 2020 | $210,899,457 | 210899457 | $138,321,485 | 138321485 | $72,577,972 | 72577972 |
| 2021 | $187,448,657 | 187448657 | $129,635,938 | 129635938 | $57,812,719 | 57812719 |
| 2022 | $173,879,000 | 173879000 | $147,002,411 | 147002411 | $26,876,589 | 26876589 |
| 2023 | $190,917,233 | 190917233 | $158,155,877 | 158155877 | $32,761,356 | 32761356 |
| 2024 | $176,933,333 | 176933333 | $133,074,721 | 133074721 | $43,858,612 | 43858612 |
| 2025 | $101,933,333 | 101933333 | $94,180,059 | 94180059 | $7,753,274 | 7753274 |
| 2026 | $84,933,333 | 84933333 | $74,818,461 | 74818461 | $10,114,872 | 10114872 |
| 2027 | $67,233,333 | 67233333 | $56,972,319 | 56972319 | $10,261,014 | 10261014 |
| 2028 | $45,833,333 | 45833333 | $45,437,759 | 45437759 | $395,574 | 395574 |
|
 2014 Houston Astros