| Player | Player Sort | Pos | Salary | Salary Sort | Pct | Pct Sort | WARP | WARP Sort | WARP/$M | WARP/$M Sort | $/WARP | $/WARP Sort | Current Status |
|---|
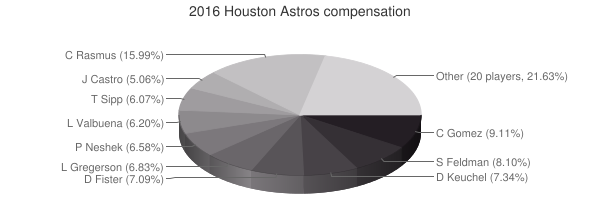
 Colby Rasmus
 |
Rasmus Colby |
LF |
$15,800,000 |
15800000 |
15.99% |
15.99 |
0.33 |
0.328959 |
0.02 |
0.020820189873418 |
$48,030,302 |
48030301.648534 |
|
 Carlos Gómez
 |
Gomez Carlos |
CF |
$9,000,000 |
9000000 |
9.11% |
9.11 |
-0.74 |
-0.743558 |
— |
0 |
— |
0 |
|
 Scott Feldman
 |
Feldman Scott |
RP |
$8,000,000 |
8000000 |
8.10% |
8.10 |
0.90 |
0.901197 |
0.11 |
0.112649625 |
$8,877,082 |
8877082.3693377 |
|
 Dallas Keuchel
 |
Keuchel Dallas |
SP |
$7,250,000 |
7250000 |
7.34% |
7.34 |
4.06 |
4.06089 |
0.56 |
0.56012275862069 |
$1,785,323 |
1785322.9218226 |
|
 Doug Fister
 |
Fister Doug |
SP |
$7,000,000 |
7000000 |
7.09% |
7.09 |
-0.36 |
-0.36241 |
— |
0 |
— |
0 |
|
 Luke Gregerson
 |
Gregerson Luke |
RP |
$6,750,000 |
6750000 |
6.83% |
6.83 |
1.73 |
1.72877 |
0.26 |
0.25611407407407 |
$3,904,510 |
3904510.1430497 |
|
 Pat Neshek
 |
Neshek Pat |
RP |
$6,500,000 |
6500000 |
6.58% |
6.58 |
0.76 |
0.76274 |
0.12 |
0.11734461538462 |
$8,521,908 |
8521907.8585101 |
|
 Luis Valbuena
 |
Valbuena Luis |
3B |
$6,125,000 |
6125000 |
6.20% |
6.20 |
2.52 |
2.51657 |
0.41 |
0.41086857142857 |
$2,433,868 |
2433868.3207699 |
|
 Tony Sipp
 |
Sipp Tony |
RP |
$6,000,000 |
6000000 |
6.07% |
6.07 |
0.43 |
0.425909 |
0.07 |
0.070984833333333 |
$14,087,516 |
14087516.347389 |
|
 Jason Castro
 |
Castro Jason |
C |
$5,000,000 |
5000000 |
5.06% |
5.06 |
2.52 |
2.5184 |
0.50 |
0.50368 |
$1,985,388 |
1985387.5476493 |
|
 Jose Altuve
 |
Altuve Jose |
2B |
$3,687,500 |
3687500 |
3.73% |
3.73 |
5.86 |
5.86479 |
1.59 |
1.5904515254237 |
$628,752 |
628752.26563952 |
|
 Evan Gattis
 |
Gattis Evan |
DH |
$3,300,000 |
3300000 |
3.34% |
3.34 |
2.78 |
2.78452 |
0.84 |
0.84379393939394 |
$1,185,123 |
1185123.4683177 |
|
 Marwin Gonzalez
 |
Gonzalez Marwin |
1B |
$2,000,000 |
2000000 |
2.02% |
2.02 |
0.08 |
0.0804061 |
0.04 |
0.04020305 |
$24,873,735 |
24873734.704208 |
|
 Jon Singleton
 |
Singleton Jon |
DNP |
$2,000,000 |
2000000 |
2.02% |
2.02 |
— |
0.00 |
— |
0 |
— |
0 |
|
 Yuli Gurriel
 |
Gurriel Yuli |
3B |
$1,900,000 |
1900000 |
1.92% |
1.92 |
-0.40 |
-0.39724 |
— |
0 |
— |
0 |
|
 Josh Fields
 |
Fields Josh |
RP |
$900,000 |
900000 |
0.91% |
0.91 |
0.01 |
0.0145259 |
0.02 |
0.016139888888889 |
$61,958,295 |
61958295.183087 |
|
 Erik Kratz
 |
Kratz Erik |
C |
$850,000 |
850000 |
0.86% |
0.86 |
-0.51 |
-0.50798 |
— |
0 |
— |
0 |
|
 Collin McHugh
 |
McHugh Collin |
SP |
$529,000 |
529000 |
0.54% |
0.54 |
3.27 |
3.27253 |
6.19 |
6.1862570888469 |
$161,649 |
161648.63270925 |
|
 Ken Giles
 |
Giles Ken |
RP |
$528,200 |
528200 |
0.53% |
0.53 |
2.16 |
2.16099 |
4.09 |
4.0912343809163 |
$244,425 |
244425.00890795 |
|
 Will Harris
 |
Harris Will |
RP |
$525,500 |
525500 |
0.53% |
0.53 |
1.99 |
1.98636 |
3.78 |
3.7799429115128 |
$264,554 |
264554.26005357 |
|
 Mike Fiers
 |
Fiers Mike |
SP |
$524,100 |
524100 |
0.53% |
0.53 |
1.73 |
1.73356 |
3.31 |
3.3076893722572 |
$302,326 |
302325.84969658 |
|
 George Springer
 |
Springer George |
RF |
$522,400 |
522400 |
0.53% |
0.53 |
4.88 |
4.87585 |
9.33 |
9.333556661562 |
$107,140 |
107140.29348729 |
|
 Jake Marisnick
 |
Marisnick Jake |
CF |
$519,500 |
519500 |
0.53% |
0.53 |
0.36 |
0.360806 |
0.69 |
0.69452550529355 |
$1,439,832 |
1439831.9318415 |
|
 Carlos Correa
 |
Correa Carlos |
SS |
$516,700 |
516700 |
0.52% |
0.52 |
4.89 |
4.88726 |
9.46 |
9.4586026707954 |
$105,724 |
105723.86163208 |
|
 Lance McCullers Jr.
 |
McCullers Lance |
SP |
$516,700 |
516700 |
0.52% |
0.52 |
1.94 |
1.93891 |
3.75 |
3.7524869363267 |
$266,490 |
266489.93506661 |
|
 Preston Tucker
 |
Tucker Preston |
DH |
$515,000 |
515000 |
0.52% |
0.52 |
-0.81 |
-0.809809 |
— |
0 |
— |
0 |
|
 Matt Duffy
 |
Duffy Matt |
PH |
$510,200 |
510200 |
0.52% |
0.52 |
-0.05 |
-0.0481893 |
— |
0 |
— |
0 |
|
 Michael Feliz
 |
Feliz Michael |
RP |
$508,200 |
508200 |
0.51% |
0.51 |
1.89 |
1.88892 |
3.72 |
3.7168831168831 |
$269,043 |
269042.62753319 |
|
 Max Stassi
 |
Stassi Max |
C |
$508,200 |
508200 |
0.51% |
0.51 |
-0.27 |
-0.269703 |
— |
0 |
— |
0 |
|
 Tyler White
 |
White Tyler |
1B |
$507,500 |
507500 |
0.51% |
0.51 |
-0.71 |
-0.709505 |
— |
0 |
— |
0 |
|
| Year | Astros payroll |
PR Sort |
Avg payroll |
AvgPR Sort |
Diff |
Diff Sort |
|---|
| 1989 | $78,000 | 78000 | $862,714 | 862714 | $-784,714 | -784714 |
| 1990 | $240,000 | 240000 | $1,203,571 | 1203571 | $-963,571 | -963571 |
| 1991 | $437,500 | 437500 | $1,884,642 | 1884642 | $-1,447,142 | -1447142 |
| 1992 | $1,375,000 | 1375000 | $2,356,071 | 2356071 | $-981,071 | -981071 |
| 1993 | $3,050,000 | 3050000 | $3,410,000 | 3410000 | $-360,000 | -360000 |
| 1994 | $3,375,000 | 3375000 | $3,911,904 | 3911904 | $-536,904 | -536904 |
| 1995 | $4,600,000 | 4600000 | $5,208,333 | 5208333 | $-608,333 | -608333 |
| 1996 | $2,000,000 | 2000000 | $4,583,416 | 4583416 | $-2,583,416 | -2583416 |
| 1997 | $6,180,000 | 6180000 | $4,892,222 | 4892222 | $1,287,778 | 1287778 |
| 1998 | $6,120,000 | 6120000 | $6,661,904 | 6661904 | $-541,904 | -541904 |
| 1999 | $6,060,000 | 6060000 | $7,867,823 | 7867823 | $-1,807,823 | -1807823 |
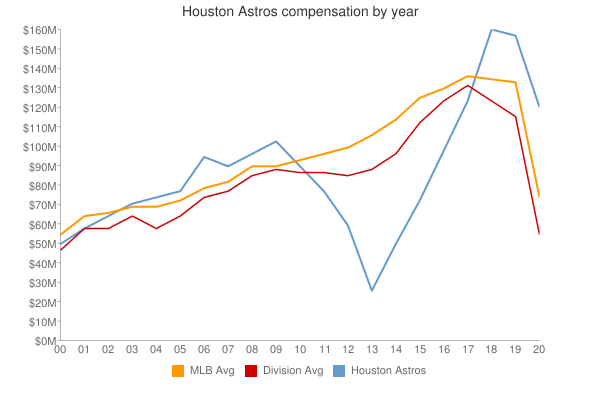
| 2000 | $51,806,667 | 51806667 | $57,491,092 | 57491092 | $-5,684,425 | -5684425 |
| 2001 | $59,632,667 | 59632667 | $67,120,750 | 67120750 | $-7,488,083 | -7488083 |
| 2002 | $65,156,750 | 65156750 | $69,204,705 | 69204705 | $-4,047,955 | -4047955 |
| 2003 | $71,040,000 | 71040000 | $72,156,639 | 72156639 | $-1,116,639 | -1116639 |
| 2004 | $75,727,000 | 75727000 | $71,426,357 | 71426357 | $4,300,643 | 4300643 |
| 2005 | $78,786,000 | 78786000 | $73,628,169 | 73628169 | $5,157,831 | 5157831 |
| 2006 | $95,998,000 | 95998000 | $81,192,832 | 81192832 | $14,805,168 | 14805168 |
| 2007 | $90,230,500 | 90230500 | $85,747,487 | 85747487 | $4,483,013 | 4483013 |
| 2008 | $96,369,000 | 96369000 | $93,079,041 | 93079041 | $3,289,959 | 3289959 |
| 2009 | $103,590,000 | 103590000 | $92,957,049 | 92957049 | $10,632,951 | 10632951 |
| 2010 | $91,605,500 | 91605500 | $94,957,956 | 94957956 | $-3,352,456 | -3352456 |
| 2011 | $77,694,000 | 77694000 | $97,426,414 | 97426414 | $-19,732,414 | -19732414 |
| 2012 | $60,799,000 | 60799000 | $100,689,500 | 100689500 | $-39,890,500 | -39890500 |
| 2013 | $26,105,600 | 26105600 | $106,658,387 | 106658387 | $-80,552,787 | -80552787 |
| 2014 | $51,985,800 | 51985800 | $115,428,670 | 115428670 | $-63,442,870 | -63442870 |
| 2015 | $72,464,200 | 72464200 | $125,458,486 | 125458486 | $-52,994,286 | -52994286 |
| 2016 | $98,793,700 | 98793700 | $130,290,910 | 130290910 | $-31,497,210 | -31497210 |
| 2017 | $124,343,900 | 124343900 | $136,573,000 | 136573000 | $-12,229,100 | -12229100 |
| 2018 | $160,393,900 | 160393900 | $135,681,867 | 135681867 | $24,712,033 | 24712033 |
| 2019 | $158,043,000 | 158043000 | $134,776,225 | 134776225 | $23,266,775 | 23266775 |
| 2020 | $210,899,457 | 210899457 | $138,321,485 | 138321485 | $72,577,972 | 72577972 |
| 2021 | $187,448,657 | 187448657 | $129,635,938 | 129635938 | $57,812,719 | 57812719 |
| 2022 | $173,879,000 | 173879000 | $147,002,411 | 147002411 | $26,876,589 | 26876589 |
| 2023 | $190,917,233 | 190917233 | $158,155,877 | 158155877 | $32,761,356 | 32761356 |
| 2024 | $176,933,333 | 176933333 | $133,074,721 | 133074721 | $43,858,612 | 43858612 |
| 2025 | $101,933,333 | 101933333 | $94,180,059 | 94180059 | $7,753,274 | 7753274 |
| 2026 | $84,933,333 | 84933333 | $74,818,461 | 74818461 | $10,114,872 | 10114872 |
| 2027 | $67,233,333 | 67233333 | $56,972,319 | 56972319 | $10,261,014 | 10261014 |
| 2028 | $45,833,333 | 45833333 | $45,437,759 | 45437759 | $395,574 | 395574 |
|
 2016 Houston Astros