| Player | Player Sort | Pos | Salary | Salary Sort | Pct | Pct Sort | WARP | WARP Sort | WARP/$M | WARP/$M Sort | $/WARP | $/WARP Sort | Current Status |
|---|
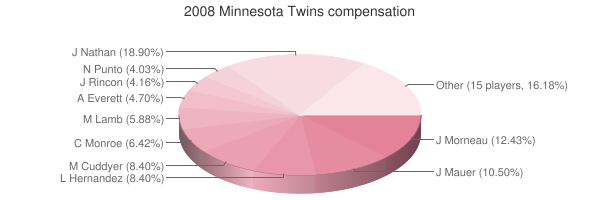
 Joe Nathan
 |
Nathan Joe |
RP |
$11,250,000 |
11250000 |
18.31% |
18.31 |
1.80 |
1.7999 |
0.16 |
0.15999111111111 |
$6,250,347 |
6250347.2415134 |
|
 Justin Morneau
 |
Morneau Justin |
1B |
$8,400,000 |
8400000 |
13.67% |
13.67 |
2.35 |
2.34613 |
0.28 |
0.27930119047619 |
$3,580,364 |
3580364.25944 |
|
 Joe Mauer
 |
Mauer Joe |
C |
$6,250,000 |
6250000 |
10.17% |
10.17 |
6.75 |
6.75397 |
1.08 |
1.0806352 |
$925,382 |
925381.66441367 |
|
 Michael Cuddyer
 |
Cuddyer Michael |
RF |
$5,916,667 |
5916667 |
9.63% |
9.63 |
1.12 |
1.11633 |
0.19 |
0.18867548232814 |
$5,300,106 |
5300105.7035106 |
|
 Livan Hernandez
 |
Hernandez Livan |
RP |
$5,000,000 |
5000000 |
8.14% |
8.14 |
-1.52 |
-1.51552 |
— |
0 |
— |
0 |
|
 Craig Monroe
 |
Monroe Craig |
DH |
$3,820,000 |
3820000 |
6.22% |
6.22 |
-0.08 |
-0.0786292 |
— |
0 |
— |
0 |
|
 Mike Lamb
 |
Lamb Mike |
3B |
$3,500,000 |
3500000 |
5.70% |
5.70 |
-0.75 |
-0.752984 |
— |
0 |
— |
0 |
|
 Adam Everett
 |
Everett Adam |
SS |
$2,800,000 |
2800000 |
4.56% |
4.56 |
0.80 |
0.80432 |
0.29 |
0.28725714285714 |
$3,481,202 |
3481201.5118361 |
|
 Juan Rincon
 |
Rincon Juan |
RP |
$2,475,000 |
2475000 |
4.03% |
4.03 |
0.16 |
0.163697 |
0.07 |
0.066140202020202 |
$15,119,397 |
15119397.423288 |
|
 Nick Punto
 |
Punto Nick |
SS |
$2,400,000 |
2400000 |
3.91% |
3.91 |
1.99 |
1.99302 |
0.83 |
0.830425 |
$1,204,203 |
1204202.6673089 |
|
 Jason Kubel
 |
Kubel Jason |
DH |
$1,300,000 |
1300000 |
2.12% |
2.12 |
2.19 |
2.18923 |
1.68 |
1.6840230769231 |
$593,816 |
593816.09058893 |
|
 Jesse Crain
 |
Crain Jesse |
RP |
$1,050,000 |
1050000 |
1.71% |
1.71 |
1.11 |
1.11041 |
1.06 |
1.0575333333333 |
$945,597 |
945596.67149972 |
|
 Dennys Reyes
 |
Reyes Dennys |
RP |
$1,000,000 |
1000000 |
1.63% |
1.63 |
1.15 |
1.14713 |
1.15 |
1.14713 |
$871,741 |
871740.77916191 |
|
 Matt Guerrier
 |
Guerrier Matt |
RP |
$950,000 |
950000 |
1.55% |
1.55 |
0.54 |
0.541866 |
0.57 |
0.57038526315789 |
$1,753,201 |
1753200.975887 |
|
 Mike Redmond
 |
Redmond Mike |
C |
$950,000 |
950000 |
1.55% |
1.55 |
-0.13 |
-0.132849 |
— |
0 |
— |
0 |
|
 Delmon Young
 |
Young Delmon |
LF |
$700,000 |
700000 |
1.14% |
1.14 |
0.97 |
0.970348 |
1.39 |
1.3862114285714 |
$721,391 |
721390.67633468 |
|
 Pat Neshek
 |
Neshek Pat |
RP |
$435,000 |
435000 |
0.71% |
0.71 |
0.37 |
0.367767 |
0.85 |
0.84544137931034 |
$1,182,814 |
1182814.1187219 |
|
 Boof Bonser
 |
Bonser Boof |
RP |
$432,500 |
432500 |
0.70% |
0.70 |
1.82 |
1.81616 |
4.20 |
4.1992138728324 |
$238,140 |
238139.81147036 |
|
 Brendan Harris
 |
Harris Brendan |
SS |
$431,000 |
431000 |
0.70% |
0.70 |
0.88 |
0.878919 |
2.04 |
2.0392552204176 |
$490,375 |
490375.10851398 |
|
 Scott Baker
 |
Baker Scott |
RP |
$422,500 |
422500 |
0.69% |
0.69 |
2.45 |
2.45489 |
5.81 |
5.8103905325444 |
$172,105 |
172105.47112091 |
|
 Carlos Gómez
 |
Gomez Carlos |
CF |
$395,000 |
395000 |
0.64% |
0.64 |
2.01 |
2.00945 |
5.09 |
5.0872151898734 |
$196,571 |
196571.20107492 |
|
 Kevin Slowey
 |
Slowey Kevin |
RP |
$395,000 |
395000 |
0.64% |
0.64 |
2.96 |
2.96251 |
7.50 |
7.5000253164557 |
$133,333 |
133332.88326453 |
|
 Nick Blackburn
 |
Blackburn Nick |
RP |
$390,000 |
390000 |
0.63% |
0.63 |
0.97 |
0.971528 |
2.49 |
2.4910974358974 |
$401,430 |
401429.50074522 |
|
 Matt Tolbert
 |
Tolbert Matt |
3B |
$390,000 |
390000 |
0.63% |
0.63 |
0.48 |
0.482519 |
1.24 |
1.2372282051282 |
$808,258 |
808258.32765135 |
|
 Howie Clark
 |
Clark Howie |
1B |
$390,000 |
390000 |
0.63% |
0.63 |
0.01 |
0.0109328 |
0.03 |
0.028032820512821 |
$35,672,472 |
35672471.827894 |
|
| Year | Twins payroll |
PR Sort |
Avg payroll |
AvgPR Sort |
Diff |
Diff Sort |
|---|
| 1984 | $50,000 | 50000 | $260,000 | 260000 | $-210,000 | -210000 |
| 1985 | $130,000 | 130000 | $437,500 | 437500 | $-307,500 | -307500 |
| 1986 | $265,000 | 265000 | $552,000 | 552000 | $-287,000 | -287000 |
| 1987 | $465,000 | 465000 | $589,500 | 589500 | $-124,500 | -124500 |
| 1988 | $1,210,000 | 1210000 | $732,083 | 732083 | $477,917 | 477917 |
| 1989 | $2,050,000 | 2050000 | $862,714 | 862714 | $1,187,286 | 1187286 |
| 1990 | $2,700,000 | 2700000 | $1,203,571 | 1203571 | $1,496,429 | 1496429 |
| 1991 | $3,000,000 | 3000000 | $1,884,642 | 1884642 | $1,115,358 | 1115358 |
| 1992 | $3,300,000 | 3300000 | $2,356,071 | 2356071 | $943,929 | 943929 |
| 1993 | $5,200,000 | 5200000 | $3,410,000 | 3410000 | $1,790,000 | 1790000 |
| 1994 | $5,200,000 | 5200000 | $3,911,904 | 3911904 | $1,288,096 | 1288096 |
| 1995 | $6,200,000 | 6200000 | $5,208,333 | 5208333 | $991,667 | 991667 |
| 1996 | $6,200,000 | 6200000 | $4,583,416 | 4583416 | $1,616,584 | 1616584 |
| 1997 | $7,200,000 | 7200000 | $4,892,222 | 4892222 | $2,307,778 | 2307778 |
| 2000 | $16,542,500 | 16542500 | $56,164,089 | 56164089 | $-39,621,589 | -39621589 |
| 2001 | $23,930,000 | 23930000 | $65,991,638 | 65991638 | $-42,061,638 | -42061638 |
| 2002 | $39,950,000 | 39950000 | $68,244,471 | 68244471 | $-28,294,471 | -28294471 |
| 2003 | $55,275,000 | 55275000 | $71,318,479 | 71318479 | $-16,043,479 | -16043479 |
| 2004 | $53,815,000 | 53815000 | $70,466,961 | 70466961 | $-16,651,961 | -16651961 |
| 2005 | $56,556,000 | 56556000 | $73,264,780 | 73264780 | $-16,708,780 | -16708780 |
| 2006 | $65,024,500 | 65024500 | $79,051,754 | 79051754 | $-14,027,254 | -14027254 |
| 2007 | $72,189,500 | 72189500 | $83,931,138 | 83931138 | $-11,741,638 | -11741638 |
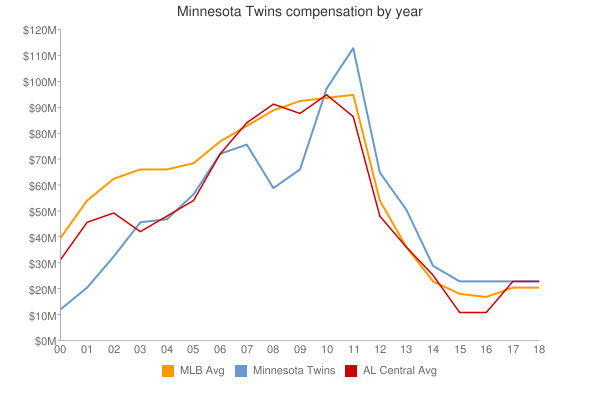
| 2008 | $61,442,667 | 61442667 | $90,812,373 | 90812373 | $-29,369,706 | -29369706 |
| 2009 | $67,027,267 | 67027267 | $91,093,211 | 91093211 | $-24,065,944 | -24065944 |
| 2010 | $98,159,167 | 98159167 | $93,373,681 | 93373681 | $4,785,486 | 4785486 |
| 2011 | $113,237,000 | 113237000 | $96,102,034 | 96102034 | $17,134,966 | 17134966 |
| 2012 | $100,431,000 | 100431000 | $100,657,138 | 100657138 | $-226,138 | -226138 |
| 2013 | $82,010,000 | 82010000 | $109,024,990 | 109024990 | $-27,014,990 | -27014990 |
| 2014 | $92,874,836 | 92874836 | $117,828,782 | 117828782 | $-24,953,946 | -24953946 |
| 2015 | $108,262,500 | 108262500 | $127,404,244 | 127404244 | $-19,141,744 | -19141744 |
| 2016 | $105,333,700 | 105333700 | $132,219,407 | 132219407 | $-26,885,707 | -26885707 |
| 2017 | $108,102,500 | 108102500 | $137,302,894 | 137302894 | $-29,200,394 | -29200394 |
| 2018 | $128,713,226 | 128713226 | $136,929,168 | 136929168 | $-8,215,942 | -8215942 |
| 2019 | $119,651,933 | 119651933 | $136,944,257 | 136944257 | $-17,292,324 | -17292324 |
| 2020 | $131,799,311 | 131799311 | $140,677,788 | 140677788 | $-8,878,477 | -8878477 |
| 2021 | $131,678,167 | 131678167 | $132,162,631 | 132162631 | $-484,464 | -484464 |
| 2022 | $141,020,356 | 141020356 | $149,374,046 | 149374046 | $-8,353,690 | -8353690 |
| 2023 | $154,063,740 | 154063740 | $160,460,390 | 160460390 | $-6,396,650 | -6396650 |
| 2024 | $108,346,590 | 108346590 | $135,504,022 | 135504022 | $-27,157,432 | -27157432 |
| 2025 | $96,981,190 | 96981190 | $96,417,302 | 96417302 | $563,888 | 563888 |
| 2026 | $70,726,190 | 70726190 | $76,694,120 | 76694120 | $-5,967,930 | -5967930 |
| 2027 | $68,726,190 | 68726190 | $58,935,617 | 58935617 | $9,790,573 | 9790573 |
| 2028 | $46,476,190 | 46476190 | $45,437,759 | 45437759 | $1,038,431 | 1038431 |
|
 2008 Minnesota Twins