| Player | Player Sort | Pos | Salary | Salary Sort | Pct | Pct Sort | WARP | WARP Sort | WARP/$M | WARP/$M Sort | $/WARP | $/WARP Sort | Current Status |
|---|
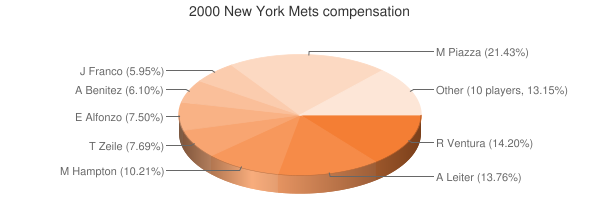
 Mike Piazza
 |
Piazza Mike |
C |
$12,071,429 |
12071429 |
15.19% |
15.19 |
5.90 |
5.90204 |
0.49 |
0.48892637317421 |
$2,045,298 |
2045297.7275654 |
|
 Robin Ventura
 |
Ventura Robin |
3B |
$8,000,000 |
8000000 |
10.07% |
10.07 |
2.12 |
2.12373 |
0.27 |
0.26546625 |
$3,766,957 |
3766957.1932402 |
|
 Al Leiter
 |
Leiter Al |
RP |
$7,750,000 |
7750000 |
9.75% |
9.75 |
6.88 |
6.8784 |
0.89 |
0.88753548387097 |
$1,126,716 |
1126715.5152361 |
|
 Mike Hampton
 |
Hampton Mike |
RP |
$5,750,000 |
5750000 |
7.24% |
7.24 |
5.70 |
5.69761 |
0.99 |
0.99088869565217 |
$1,009,195 |
1009195.0835526 |
|
 Bobby Jones
 |
Jones Bobby |
RP |
$5,366,667 |
5366667 |
6.75% |
6.75 |
1.50 |
1.50237 |
0.28 |
0.27994470310902 |
$3,572,134 |
3572134.0282354 |
|
 Derek Bell
 |
Bell Derek |
RF |
$5,000,000 |
5000000 |
6.29% |
6.29 |
0.02 |
0.0231745 |
0.00 |
0.0046349 |
$215,754,385 |
215754385.20788 |
|
 Rick Reed
 |
Reed Rick |
RP |
$4,350,000 |
4350000 |
5.48% |
5.48 |
5.35 |
5.34937 |
1.23 |
1.2297402298851 |
$813,180 |
813179.86977906 |
|
 Todd Zeile
 |
Zeile Todd |
1B |
$4,333,333 |
4333333 |
5.45% |
5.45 |
1.72 |
1.7221 |
0.40 |
0.39740772287752 |
$2,516,307 |
2516307.415365 |
|
 Edgardo Alfonzo
 |
Alfonzo Edgardo |
2B |
$4,000,000 |
4000000 |
5.03% |
5.03 |
5.84 |
5.83606 |
1.46 |
1.459015 |
$685,394 |
685393.91301666 |
|
 Armando Benitez
 |
Benitez Armando |
RP |
$3,687,500 |
3687500 |
4.64% |
4.64 |
2.50 |
2.49904 |
0.68 |
0.67770576271186 |
$1,475,567 |
1475566.6175812 |
|
 Darryl Hamilton
 |
Hamilton Darryl |
LF |
$3,633,333 |
3633333 |
4.57% |
4.57 |
0.12 |
0.123485 |
0.03 |
0.033986700365752 |
$29,423,274 |
29423274.081872 |
|
 John Franco
 |
Franco John |
RP |
$3,350,000 |
3350000 |
4.22% |
4.22 |
1.47 |
1.47248 |
0.44 |
0.43954626865672 |
$2,275,073 |
2275073.3456482 |
|
 Rey Ordonez
 |
Ordonez Rey |
SS |
$2,250,000 |
2250000 |
2.83% |
2.83 |
-0.99 |
-0.992683 |
— |
0 |
— |
0 |
|
 Dennis Cook
 |
Cook Dennis |
RP |
$2,200,000 |
2200000 |
2.77% |
2.77 |
0.79 |
0.791236 |
0.36 |
0.35965272727273 |
$2,780,460 |
2780459.9386277 |
|
 Turk Wendell
 |
Wendell Turk |
RP |
$2,050,000 |
2050000 |
2.58% |
2.58 |
1.82 |
1.82415 |
0.89 |
0.88982926829268 |
$1,123,811 |
1123811.0900968 |
|
 Rickey Henderson
 |
Henderson Rickey |
LF |
$2,000,000 |
2000000 |
2.52% |
2.52 |
-0.32 |
-0.315525 |
— |
0 |
— |
0 |
|
 Pat Mahomes
 |
Mahomes Pat |
RP |
$750,000 |
750000 |
0.94% |
0.94 |
0.05 |
0.0548075 |
0.07 |
0.073076666666667 |
$13,684,259 |
13684258.541258 |
|
 Rich Rodriguez
 |
Rodriguez Rich |
RP |
$600,000 |
600000 |
0.76% |
0.76 |
-0.37 |
-0.36528 |
— |
0 |
— |
0 |
|
 Kurt Abbott
 |
Abbott Kurt |
SS |
$500,000 |
500000 |
0.63% |
0.63 |
-0.18 |
-0.178516 |
— |
0 |
— |
0 |
|
 Todd Pratt
 |
Pratt Todd |
C |
$500,000 |
500000 |
0.63% |
0.63 |
1.82 |
1.81556 |
3.63 |
3.63112 |
$275,397 |
275397.12265086 |
|
 Matt Franco
 |
Franco Matt |
PH |
$462,500 |
462500 |
0.58% |
0.58 |
-0.52 |
-0.519263 |
— |
0 |
— |
0 |
|
 Wily Mo Pena
 |
Pena Wily Mo |
DNP |
$220,000 |
220000 |
0.28% |
0.28 |
— |
0.00 |
— |
0 |
— |
0 |
|
 Jay Payton
 |
Payton Jay |
CF |
$215,000 |
215000 |
0.27% |
0.27 |
2.26 |
2.2584 |
10.50 |
10.504186046512 |
$95,200 |
95200.141693234 |
|
 Melvin Mora
 |
Mora Melvin |
SS |
$210,000 |
210000 |
0.26% |
0.26 |
0.29 |
0.293823 |
1.40 |
1.3991571428571 |
$714,716 |
714716.0024913 |
|
 Julio Ramirez
 |
Ramirez Julio |
DNP |
$200,000 |
200000 |
0.25% |
0.25 |
— |
0.00 |
— |
0 |
— |
0 |
|
| Year | Mets payroll |
PR Sort |
Avg payroll |
AvgPR Sort |
Diff |
Diff Sort |
|---|
| 1992 | $2,950,000 | 2950000 | $2,356,071 | 2356071 | $593,929 | 593929 |
| 1993 | $3,000,000 | 3000000 | $3,410,000 | 3410000 | $-410,000 | -410000 |
| 1994 | $3,883,333 | 3883333 | $3,447,916 | 3447916 | $435,417 | 435417 |
| 1995 | $4,883,333 | 4883333 | $4,591,041 | 4591041 | $292,292 | 292292 |
| 1996 | $5,133,333 | 5133333 | $4,109,148 | 4109148 | $1,024,185 | 1024185 |
| 1999 | $8,871,429 | 8871429 | $7,867,823 | 7867823 | $1,003,606 | 1003606 |
| 2000 | $79,449,762 | 79449762 | $55,368,142 | 55368142 | $24,081,620 | 24081620 |
| 2001 | $93,043,928 | 93043928 | $64,937,084 | 64937084 | $28,106,844 | 28106844 |
| 2002 | $91,995,260 | 91995260 | $67,238,672 | 67238672 | $24,756,588 | 24756588 |
| 2003 | $117,324,763 | 117324763 | $70,654,480 | 70654480 | $46,670,283 | 46670283 |
| 2004 | $95,283,804 | 95283804 | $69,466,729 | 69466729 | $25,817,075 | 25817075 |
| 2005 | $100,563,370 | 100563370 | $74,114,841 | 74114841 | $26,448,529 | 26448529 |
| 2006 | $102,337,140 | 102337140 | $79,621,815 | 79621815 | $22,715,325 | 22715325 |
| 2007 | $116,683,000 | 116683000 | $85,537,470 | 85537470 | $31,145,530 | 31145530 |
| 2008 | $137,759,000 | 137759000 | $92,003,799 | 92003799 | $45,755,201 | 45755201 |
| 2009 | $153,550,596 | 153550596 | $92,169,598 | 92169598 | $61,380,998 | 61380998 |
| 2010 | $127,098,096 | 127098096 | $94,342,601 | 94342601 | $32,755,495 | 32755495 |
| 2011 | $142,797,167 | 142797167 | $96,974,710 | 96974710 | $45,822,457 | 45822457 |
| 2012 | $94,508,922 | 94508922 | $100,947,217 | 100947217 | $-6,438,295 | -6438295 |
| 2013 | $93,684,590 | 93684590 | $108,586,966 | 108586966 | $-14,902,376 | -14902376 |
| 2014 | $84,951,365 | 84951365 | $117,131,361 | 117131361 | $-32,179,996 | -32179996 |
| 2015 | $101,344,283 | 101344283 | $126,168,161 | 126168161 | $-24,823,878 | -24823878 |
| 2016 | $135,188,085 | 135188085 | $131,756,569 | 131756569 | $3,431,516 | 3431516 |
| 2017 | $154,437,460 | 154437460 | $136,337,445 | 136337445 | $18,100,015 | 18100015 |
| 2018 | $150,558,844 | 150558844 | $135,360,600 | 135360600 | $15,198,244 | 15198244 |
| 2019 | $157,052,231 | 157052231 | $134,792,134 | 134792134 | $22,260,097 | 22260097 |
| 2020 | $170,725,429 | 170725429 | $139,496,467 | 139496467 | $31,228,962 | 31228962 |
| 2021 | $215,623,963 | 215623963 | $130,712,288 | 130712288 | $84,911,675 | 84911675 |
| 2022 | $278,683,333 | 278683333 | $149,802,695 | 149802695 | $128,880,638 | 128880638 |
| 2023 | $359,669,166 | 359669166 | $161,692,345 | 161692345 | $197,976,821 | 197976821 |
| 2024 | $286,854,409 | 286854409 | $136,306,249 | 136306249 | $150,548,160 | 150548160 |
| 2025 | $138,459,294 | 138459294 | $98,329,527 | 98329527 | $40,129,767 | 40129767 |
| 2026 | $101,577,765 | 101577765 | $78,039,273 | 78039273 | $23,538,492 | 23538492 |
| 2027 | $87,827,765 | 87827765 | $60,919,343 | 60919343 | $26,908,422 | 26908422 |
| 2028 | $54,600,000 | 54600000 | $46,901,712 | 46901712 | $7,698,288 | 7698288 |
| 2029 | $54,600,000 | 54600000 | $38,597,944 | 38597944 | $16,002,056 | 16002056 |
| 2030 | $54,600,000 | 54600000 | $41,447,579 | 41447579 | $13,152,421 | 13152421 |
| 2031 | $34,100,000 | 34100000 | $38,360,152 | 38360152 | $-4,260,152 | -4260152 |
|
 2000 New York Mets