| Player | Player Sort | Pos | Salary | Salary Sort | Pct | Pct Sort | WARP | WARP Sort | WARP/$M | WARP/$M Sort | $/WARP | $/WARP Sort | Current Status |
|---|
 Mo Vaughn
 |
Vaughn Mo |
1B |
$12,166,667 |
12166667 |
13.23% |
13.23 |
0.20 |
0.204 |
0.02 |
0.016767122828298 |
$59,640,525 |
59640524.509804 |
|
 Mike Piazza
 |
Piazza Mike |
C |
$10,571,429 |
10571429 |
11.49% |
11.49 |
4.99 |
4.9917 |
0.47 |
0.47218781869509 |
$2,117,801 |
2117801.3502414 |
|
 Al Leiter
 |
Leiter Al |
RP |
$9,250,000 |
9250000 |
10.05% |
10.05 |
5.43 |
5.4329 |
0.59 |
0.58734054054054 |
$1,702,590 |
1702589.7770988 |
|
 Roberto Alomar
 |
Alomar Roberto |
2B |
$7,939,664 |
7939664 |
8.63% |
8.63 |
-0.36 |
-0.357987 |
— |
0 |
— |
0 |
|
 Jeromy Burnitz
 |
Burnitz Jeromy |
RF |
$7,166,667 |
7166667 |
7.79% |
7.79 |
-0.62 |
-0.620435 |
— |
0 |
— |
0 |
|
 Rey Ordonez
 |
Ordonez Rey |
SS |
$6,250,000 |
6250000 |
6.79% |
6.79 |
1.20 |
1.19949 |
0.19 |
0.1919184 |
$5,210,548 |
5210547.8161552 |
|
 Shawn Estes
 |
Estes Shawn |
RP |
$6,200,000 |
6200000 |
6.74% |
6.74 |
1.37 |
1.3731 |
0.22 |
0.22146774193548 |
$4,515,330 |
4515330.2745612 |
|
 Edgardo Alfonzo
 |
Alfonzo Edgardo |
3B |
$6,200,000 |
6200000 |
6.74% |
6.74 |
5.03 |
5.03474 |
0.81 |
0.81205483870968 |
$1,231,444 |
1231443.9275911 |
|
 Armando Benitez
 |
Benitez Armando |
RP |
$5,812,500 |
5812500 |
6.32% |
6.32 |
1.89 |
1.89199 |
0.33 |
0.32550365591398 |
$3,072,162 |
3072162.1150217 |
|
 Steve Trachsel
 |
Trachsel Steve |
RP |
$4,300,000 |
4300000 |
4.67% |
4.67 |
2.12 |
2.12097 |
0.49 |
0.4932488372093 |
$2,027,374 |
2027374.2674342 |
|
 Pedro Astacio
 |
Astacio Pedro |
RP |
$4,000,000 |
4000000 |
4.35% |
4.35 |
3.63 |
3.63408 |
0.91 |
0.90852 |
$1,100,691 |
1100691.234095 |
|
 Roger Cedeno
 |
Cedeno Roger |
LF |
$2,375,000 |
2375000 |
2.58% |
2.58 |
-0.14 |
-0.144174 |
— |
0 |
— |
0 |
|
 Jeff D'Amico
 |
D'Amico Jeff |
RP |
$1,840,000 |
1840000 |
2.00% |
2.00 |
2.34 |
2.3373 |
1.27 |
1.2702717391304 |
$787,233 |
787233.13224661 |
|
 David Weathers
 |
Weathers David |
RP |
$1,833,333 |
1833333 |
1.99% |
1.99 |
1.10 |
1.10218 |
0.60 |
0.60118920021622 |
$1,663,370 |
1663369.8669909 |
|
 Mark Guthrie
 |
Guthrie Mark |
RP |
$1,800,000 |
1800000 |
1.96% |
1.96 |
0.77 |
0.765779 |
0.43 |
0.42543277777778 |
$2,350,548 |
2350547.6123007 |
|
 Joe McEwing
 |
McEwing Joe |
PH |
$750,000 |
750000 |
0.82% |
0.82 |
-0.81 |
-0.806423 |
— |
0 |
— |
0 |
|
 John Valentin
 |
Valentin John |
PH |
$550,000 |
550000 |
0.60% |
0.60 |
1.04 |
1.04226 |
1.90 |
1.8950181818182 |
$527,699 |
527699.422409 |
|
 Satoru Komiyama
 |
Komiyama Satoru |
RP |
$500,000 |
500000 |
0.54% |
0.54 |
0.59 |
0.589629 |
1.18 |
1.179258 |
$847,991 |
847990.85526662 |
|
 Mark Johnson
 |
Johnson Mark |
PH |
$475,000 |
475000 |
0.52% |
0.52 |
-0.35 |
-0.347985 |
— |
0 |
— |
0 |
|
 Jay Payton
 |
Payton Jay |
CF |
$362,500 |
362500 |
0.39% |
0.39 |
1.37 |
1.36507 |
3.77 |
3.7657103448276 |
$265,554 |
265554.14740636 |
|
 Bruce Chen
 |
Chen Bruce |
RP |
$300,000 |
300000 |
0.33% |
0.33 |
0.03 |
0.0269305 |
0.09 |
0.089768333333333 |
$11,139,786 |
11139785.744788 |
|
 Gary Matthews
 |
Matthews Gary |
PH |
$237,500 |
237500 |
0.26% |
0.26 |
-0.02 |
-0.0162894 |
— |
0 |
— |
0 |
|
 Kane Davis
 |
Davis Kane |
RP |
$235,000 |
235000 |
0.26% |
0.26 |
0.44 |
0.440915 |
1.88 |
1.8762340425532 |
$532,983 |
532982.54765658 |
|
 Timo Perez
 |
Perez Timo |
CF |
$222,500 |
222500 |
0.24% |
0.24 |
2.78 |
2.78337 |
12.51 |
12.509528089888 |
$79,939 |
79939.066670978 |
|
 Vance Wilson
 |
Wilson Vance |
C |
$222,500 |
222500 |
0.24% |
0.24 |
0.68 |
0.677538 |
3.05 |
3.0451146067416 |
$328,395 |
328394.86493746 |
|
 McKay Christensen
 |
Christensen McKay |
LF |
$222,500 |
222500 |
0.24% |
0.24 |
0.03 |
0.029029 |
0.13 |
0.13046741573034 |
$7,664,749 |
7664749.0440594 |
|
 Grant Roberts
 |
Roberts Grant |
RP |
$212,500 |
212500 |
0.23% |
0.23 |
0.75 |
0.747083 |
3.52 |
3.5156847058824 |
$284,440 |
284439.61380462 |
|
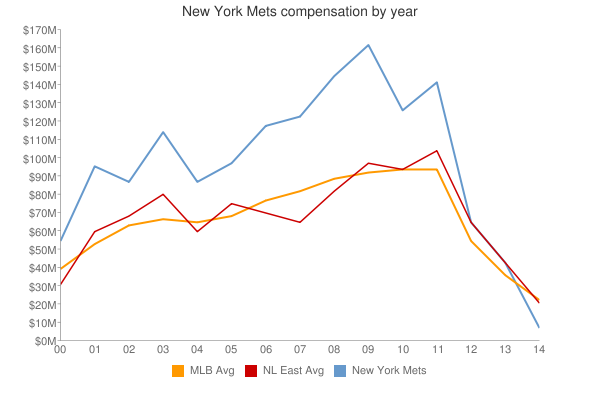
| Year | Mets payroll |
PR Sort |
Avg payroll |
AvgPR Sort |
Diff |
Diff Sort |
|---|
| 1992 | $2,950,000 | 2950000 | $2,356,071 | 2356071 | $593,929 | 593929 |
| 1993 | $3,000,000 | 3000000 | $3,410,000 | 3410000 | $-410,000 | -410000 |
| 1994 | $3,883,333 | 3883333 | $3,447,916 | 3447916 | $435,417 | 435417 |
| 1995 | $4,883,333 | 4883333 | $4,591,041 | 4591041 | $292,292 | 292292 |
| 1996 | $5,133,333 | 5133333 | $4,109,148 | 4109148 | $1,024,185 | 1024185 |
| 1999 | $8,871,429 | 8871429 | $7,867,823 | 7867823 | $1,003,606 | 1003606 |
| 2000 | $79,449,762 | 79449762 | $55,368,142 | 55368142 | $24,081,620 | 24081620 |
| 2001 | $93,043,928 | 93043928 | $64,937,084 | 64937084 | $28,106,844 | 28106844 |
| 2002 | $91,995,260 | 91995260 | $67,238,672 | 67238672 | $24,756,588 | 24756588 |
| 2003 | $117,324,763 | 117324763 | $70,654,480 | 70654480 | $46,670,283 | 46670283 |
| 2004 | $95,283,804 | 95283804 | $69,466,729 | 69466729 | $25,817,075 | 25817075 |
| 2005 | $100,563,370 | 100563370 | $74,114,841 | 74114841 | $26,448,529 | 26448529 |
| 2006 | $102,337,140 | 102337140 | $79,621,815 | 79621815 | $22,715,325 | 22715325 |
| 2007 | $116,683,000 | 116683000 | $85,537,470 | 85537470 | $31,145,530 | 31145530 |
| 2008 | $137,759,000 | 137759000 | $92,003,799 | 92003799 | $45,755,201 | 45755201 |
| 2009 | $153,550,596 | 153550596 | $92,169,598 | 92169598 | $61,380,998 | 61380998 |
| 2010 | $127,098,096 | 127098096 | $94,342,601 | 94342601 | $32,755,495 | 32755495 |
| 2011 | $142,797,167 | 142797167 | $96,974,710 | 96974710 | $45,822,457 | 45822457 |
| 2012 | $94,508,922 | 94508922 | $100,947,217 | 100947217 | $-6,438,295 | -6438295 |
| 2013 | $93,684,590 | 93684590 | $108,586,966 | 108586966 | $-14,902,376 | -14902376 |
| 2014 | $84,951,365 | 84951365 | $117,131,361 | 117131361 | $-32,179,996 | -32179996 |
| 2015 | $101,344,283 | 101344283 | $126,168,161 | 126168161 | $-24,823,878 | -24823878 |
| 2016 | $135,188,085 | 135188085 | $131,756,569 | 131756569 | $3,431,516 | 3431516 |
| 2017 | $154,437,460 | 154437460 | $136,337,445 | 136337445 | $18,100,015 | 18100015 |
| 2018 | $150,558,844 | 150558844 | $135,360,600 | 135360600 | $15,198,244 | 15198244 |
| 2019 | $157,052,231 | 157052231 | $134,792,134 | 134792134 | $22,260,097 | 22260097 |
| 2020 | $170,725,429 | 170725429 | $139,496,467 | 139496467 | $31,228,962 | 31228962 |
| 2021 | $215,623,963 | 215623963 | $130,712,288 | 130712288 | $84,911,675 | 84911675 |
| 2022 | $278,683,333 | 278683333 | $149,802,695 | 149802695 | $128,880,638 | 128880638 |
| 2023 | $359,669,166 | 359669166 | $161,692,345 | 161692345 | $197,976,821 | 197976821 |
| 2024 | $286,854,409 | 286854409 | $136,306,249 | 136306249 | $150,548,160 | 150548160 |
| 2025 | $138,459,294 | 138459294 | $98,329,527 | 98329527 | $40,129,767 | 40129767 |
| 2026 | $101,577,765 | 101577765 | $78,039,273 | 78039273 | $23,538,492 | 23538492 |
| 2027 | $87,827,765 | 87827765 | $60,919,343 | 60919343 | $26,908,422 | 26908422 |
| 2028 | $54,600,000 | 54600000 | $46,901,712 | 46901712 | $7,698,288 | 7698288 |
| 2029 | $54,600,000 | 54600000 | $38,597,944 | 38597944 | $16,002,056 | 16002056 |
| 2030 | $54,600,000 | 54600000 | $41,447,579 | 41447579 | $13,152,421 | 13152421 |
| 2031 | $34,100,000 | 34100000 | $38,360,152 | 38360152 | $-4,260,152 | -4260152 |
|
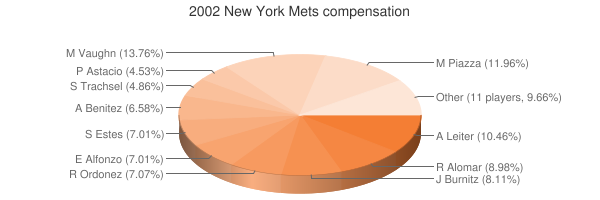
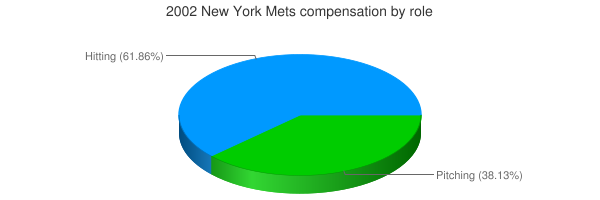
 2002 New York Mets