| Player | Player Sort | Pos | Salary | Salary Sort | Pct | Pct Sort | WARP | WARP Sort | WARP/$M | WARP/$M Sort | $/WARP | $/WARP Sort | Current Status |
|---|
 Ray Lankford
 |
Lankford Ray |
LF |
$8,100,000 |
8100000 |
19.91% |
19.91 |
0.11 |
0.110066 |
0.01 |
0.013588395061728 |
$73,592,208 |
73592208.311377 |
|
 Trevor Hoffman
 |
Hoffman Trevor |
RP |
$6,600,000 |
6600000 |
16.22% |
16.22 |
1.84 |
1.84108 |
0.28 |
0.27895151515152 |
$3,584,852 |
3584852.3692615 |
|
 Ryan Klesko
 |
Klesko Ryan |
1B |
$6,000,000 |
6000000 |
14.75% |
14.75 |
3.20 |
3.19745 |
0.53 |
0.53290833333333 |
$1,876,495 |
1876495.3322179 |
|
 Bobby Jones
 |
Jones Bobby |
RP |
$4,000,000 |
4000000 |
9.83% |
9.83 |
0.74 |
0.743715 |
0.19 |
0.18592875 |
$5,378,404 |
5378404.3618859 |
|
 Mark Kotsay
 |
Kotsay Mark |
CF |
$3,050,000 |
3050000 |
7.50% |
7.50 |
4.26 |
4.25835 |
1.40 |
1.3961803278689 |
$716,240 |
716239.85816102 |
|
 Phil Nevin
 |
Nevin Phil |
3B |
$2,600,000 |
2600000 |
6.39% |
6.39 |
1.15 |
1.14791 |
0.44 |
0.44150384615385 |
$2,264,986 |
2264985.9309528 |
|
 Bubba Trammell
 |
Trammell Bubba |
RF |
$1,500,000 |
1500000 |
3.69% |
3.69 |
0.41 |
0.407347 |
0.27 |
0.27156466666667 |
$3,682,364 |
3682364.1759974 |
|
 Tom Lampkin
 |
Lampkin Tom |
C |
$1,250,000 |
1250000 |
3.07% |
3.07 |
0.63 |
0.627829 |
0.50 |
0.5022632 |
$1,990,988 |
1990987.9919532 |
|
 Kevin Jarvis
 |
Jarvis Kevin |
RP |
$1,250,000 |
1250000 |
3.07% |
3.07 |
0.42 |
0.417562 |
0.33 |
0.3340496 |
$2,993,567 |
2993567.4223229 |
|
 Brett Tomko
 |
Tomko Brett |
RP |
$1,100,000 |
1100000 |
2.70% |
2.70 |
3.61 |
3.61117 |
3.28 |
3.2828818181818 |
$304,610 |
304610.41712243 |
|
 Deivi Cruz
 |
Cruz Deivi |
SS |
$600,000 |
600000 |
1.47% |
1.47 |
-0.90 |
-0.903103 |
— |
0 |
— |
0 |
|
 Steve Reed
 |
Reed Steve |
RP |
$500,000 |
500000 |
1.23% |
1.23 |
0.94 |
0.939616 |
1.88 |
1.879232 |
$532,132 |
532132.27531247 |
|
 Ron Gant
 |
Gant Ron |
LF |
$500,000 |
500000 |
1.23% |
1.23 |
2.31 |
2.30699 |
4.61 |
4.61398 |
$216,733 |
216732.62562907 |
|
 Alan Embree
 |
Embree Alan |
RP |
$500,000 |
500000 |
1.23% |
1.23 |
1.00 |
0.999603 |
2.00 |
1.999206 |
$500,199 |
500198.5788358 |
|
 Wiki Gonzalez
 |
Gonzalez Wiki |
C |
$350,000 |
350000 |
0.86% |
0.86 |
-0.64 |
-0.637785 |
— |
0 |
— |
0 |
|
 Mark Sweeney
 |
Sweeney Mark |
PH |
$300,000 |
300000 |
0.74% |
0.74 |
-0.72 |
-0.720878 |
— |
0 |
— |
0 |
|
 Trenidad Hubbard
 |
Hubbard Trenidad |
RF |
$300,000 |
300000 |
0.74% |
0.74 |
-0.05 |
-0.0513201 |
— |
0 |
— |
0 |
|
 Brian Tollberg
 |
Tollberg Brian |
RP |
$285,000 |
285000 |
0.70% |
0.70 |
0.73 |
0.732238 |
2.57 |
2.5692561403509 |
$389,218 |
389217.71336642 |
|
 Adam Eaton
 |
Eaton Adam |
RP |
$280,000 |
280000 |
0.69% |
0.69 |
0.24 |
0.239476 |
0.86 |
0.85527142857143 |
$1,169,219 |
1169219.4624931 |
|
 Tom Davey
 |
Davey Tom |
RP |
$270,000 |
270000 |
0.66% |
0.66 |
0.25 |
0.251728 |
0.93 |
0.93232592592593 |
$1,072,586 |
1072586.2836077 |
|
 Jason Boyd
 |
Boyd Jason |
RP |
$253,000 |
253000 |
0.62% |
0.62 |
-0.05 |
-0.0457386 |
— |
0 |
— |
0 |
|
 D'Angelo Jimenez
 |
Jimenez D'Angelo |
2B |
$240,000 |
240000 |
0.59% |
0.59 |
0.64 |
0.638147 |
2.66 |
2.6589458333333 |
$376,089 |
376088.89487845 |
|
 Brian Lawrence
 |
Lawrence Brian |
RP |
$235,000 |
235000 |
0.58% |
0.58 |
4.92 |
4.92393 |
20.95 |
20.952893617021 |
$47,726 |
47726.104960875 |
|
 Jeremy Fikac
 |
Fikac Jeremy |
RP |
$210,000 |
210000 |
0.52% |
0.52 |
0.62 |
0.621989 |
2.96 |
2.9618523809524 |
$337,627 |
337626.54966567 |
|
 Ramón Vázquez
 |
Vazquez Ramon |
2B |
$205,000 |
205000 |
0.50% |
0.50 |
1.26 |
1.26254 |
6.16 |
6.1587317073171 |
$162,371 |
162371.09319309 |
|
 Sean Burroughs
 |
Burroughs Sean |
3B |
$200,000 |
200000 |
0.49% |
0.49 |
-0.03 |
-0.0296251 |
— |
0 |
— |
0 |
|
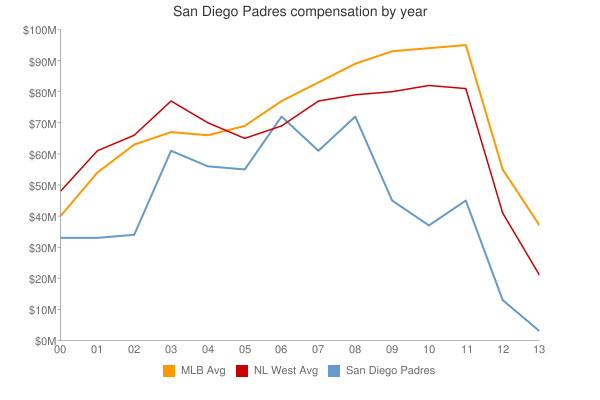
| Year | Padres payroll |
PR Sort |
Avg payroll |
AvgPR Sort |
Diff |
Diff Sort |
|---|
| 1996 | $2,000,000 | 2000000 | $4,109,148 | 4109148 | $-2,109,148 | -2109148 |
| 1997 | $2,000,000 | 2000000 | $4,753,000 | 4753000 | $-2,753,000 | -2753000 |
| 2000 | $53,816,000 | 53816000 | $55,368,142 | 55368142 | $-1,552,142 | -1552142 |
| 2001 | $37,438,000 | 37438000 | $64,937,084 | 64937084 | $-27,499,084 | -27499084 |
| 2002 | $40,678,000 | 40678000 | $67,238,672 | 67238672 | $-26,560,672 | -26560672 |
| 2003 | $43,565,000 | 43565000 | $70,654,480 | 70654480 | $-27,089,480 | -27089480 |
| 2004 | $59,172,333 | 59172333 | $69,466,729 | 69466729 | $-10,294,396 | -10294396 |
| 2005 | $62,186,333 | 62186333 | $74,114,841 | 74114841 | $-11,928,508 | -11928508 |
| 2006 | $69,170,167 | 69170167 | $79,621,815 | 79621815 | $-10,451,648 | -10451648 |
| 2007 | $58,571,067 | 58571067 | $85,537,470 | 85537470 | $-26,966,403 | -26966403 |
| 2008 | $74,010,117 | 74010117 | $92,003,799 | 92003799 | $-17,993,682 | -17993682 |
| 2009 | $44,173,200 | 44173200 | $92,169,598 | 92169598 | $-47,996,398 | -47996398 |
| 2010 | $37,799,300 | 37799300 | $94,342,601 | 94342601 | $-56,543,301 | -56543301 |
| 2011 | $45,869,140 | 45869140 | $96,974,710 | 96974710 | $-51,105,570 | -51105570 |
| 2012 | $55,621,900 | 55621900 | $100,947,217 | 100947217 | $-45,325,317 | -45325317 |
| 2013 | $68,333,600 | 68333600 | $108,586,966 | 108586966 | $-40,253,366 | -40253366 |
| 2014 | $90,636,600 | 90636600 | $117,131,361 | 117131361 | $-26,494,761 | -26494761 |
| 2015 | $108,387,033 | 108387033 | $126,168,161 | 126168161 | $-17,781,128 | -17781128 |
| 2016 | $100,509,500 | 100509500 | $131,756,569 | 131756569 | $-31,247,069 | -31247069 |
| 2017 | $67,624,400 | 67624400 | $136,337,445 | 136337445 | $-68,713,045 | -68713045 |
| 2018 | $94,037,733 | 94037733 | $135,360,600 | 135360600 | $-41,322,867 | -41322867 |
| 2019 | $100,804,100 | 100804100 | $134,792,134 | 134792134 | $-33,988,034 | -33988034 |
| 2020 | $151,461,550 | 151461550 | $139,496,467 | 139496467 | $11,965,083 | 11965083 |
| 2021 | $171,488,220 | 171488220 | $130,712,288 | 130712288 | $40,775,932 | 40775932 |
| 2022 | $212,846,719 | 212846719 | $149,802,695 | 149802695 | $63,044,024 | 63044024 |
| 2023 | $221,599,740 | 221599740 | $161,692,345 | 161692345 | $59,907,395 | 59907395 |
| 2024 | $153,892,054 | 153892054 | $136,306,249 | 136306249 | $17,585,805 | 17585805 |
| 2025 | $150,295,454 | 150295454 | $98,329,527 | 98329527 | $51,965,927 | 51965927 |
| 2026 | $137,745,454 | 137745454 | $78,039,273 | 78039273 | $59,706,181 | 59706181 |
| 2027 | $156,495,454 | 156495454 | $60,919,343 | 60919343 | $95,576,111 | 95576111 |
| 2028 | $124,545,454 | 124545454 | $46,901,712 | 46901712 | $77,643,742 | 77643742 |
| 2029 | $113,545,454 | 113545454 | $38,597,944 | 38597944 | $74,947,510 | 74947510 |
| 2030 | $113,545,454 | 113545454 | $41,447,579 | 41447579 | $72,097,875 | 72097875 |
| 2031 | $101,259,739 | 101259739 | $38,360,152 | 38360152 | $62,899,587 | 62899587 |
| 2032 | $101,259,739 | 101259739 | $47,925,459 | 47925459 | $53,334,280 | 53334280 |
| 2033 | $101,259,739 | 101259739 | $43,068,924 | 43068924 | $58,190,815 | 58190815 |
| 2034 | $36,714,285 | 36714285 | $29,428,571 | 29428571 | $7,285,714 | 7285714 |
|
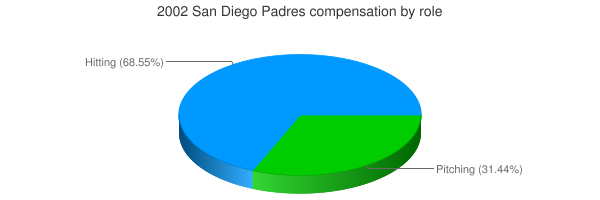
 2002 San Diego Padres