| Player | Player Sort | Pos | Salary | Salary Sort | Pct | Pct Sort | WARP | WARP Sort | WARP/$M | WARP/$M Sort | $/WARP | $/WARP Sort | Current Status |
|---|
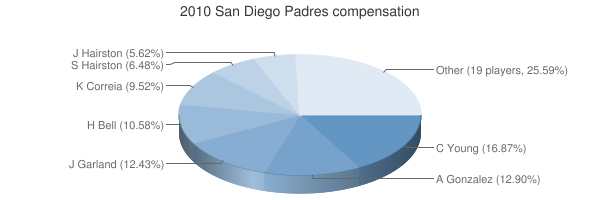
 Chris Young
 |
Young Chris |
RP |
$6,375,000 |
6375000 |
16.87% |
16.87 |
0.18 |
0.179618 |
0.03 |
0.02817537254902 |
$35,491,989 |
35491988.553486 |
|
 Adrián González
 |
Gonzalez Adrian |
1B |
$4,875,000 |
4875000 |
12.90% |
12.90 |
7.36 |
7.36324 |
1.51 |
1.5104082051282 |
$662,073 |
662072.67452915 |
|
 Jon Garland
 |
Garland Jon |
RP |
$4,700,000 |
4700000 |
12.43% |
12.43 |
3.34 |
3.3433 |
0.71 |
0.71134042553191 |
$1,405,797 |
1405796.6679628 |
|
 Heath Bell
 |
Bell Heath |
RP |
$4,000,000 |
4000000 |
10.58% |
10.58 |
1.61 |
1.60999 |
0.40 |
0.4024975 |
$2,484,487 |
2484487.4812887 |
|
 Kevin Correia
 |
Correia Kevin |
RP |
$3,600,000 |
3600000 |
9.52% |
9.52 |
0.74 |
0.735004 |
0.20 |
0.20416777777778 |
$4,897,933 |
4897932.5282583 |
|
 Scott Hairston
 |
Hairston Scott |
LF |
$2,450,000 |
2450000 |
6.48% |
6.48 |
0.54 |
0.543919 |
0.22 |
0.22200775510204 |
$4,504,347 |
4504347.1546315 |
|
 Jerry Hairston
 |
Hairston Jerry |
SS |
$2,125,000 |
2125000 |
5.62% |
5.62 |
1.49 |
1.49156 |
0.70 |
0.70191058823529 |
$1,424,683 |
1424682.8823514 |
|
 David Eckstein
 |
Eckstein David |
2B |
$1,000,000 |
1000000 |
2.65% |
2.65 |
0.67 |
0.669269 |
0.67 |
0.669269 |
$1,494,168 |
1494167.517097 |
|
 Mike Adams
 |
Adams Mike |
RP |
$1,000,000 |
1000000 |
2.65% |
2.65 |
1.59 |
1.5876 |
1.59 |
1.5876 |
$629,882 |
629881.58226253 |
|
 Yorvit Torrealba
 |
Torrealba Yorvit |
C |
$750,000 |
750000 |
1.98% |
1.98 |
4.32 |
4.31664 |
5.76 |
5.75552 |
$173,746 |
173746.24708106 |
|
 Matt Stairs
 |
Stairs Matt |
PH |
$700,000 |
700000 |
1.85% |
1.85 |
0.61 |
0.606243 |
0.87 |
0.86606142857143 |
$1,154,653 |
1154652.5073279 |
|
 Chase Headley
 |
Headley Chase |
3B |
$427,700 |
427700 |
1.13% |
1.13 |
3.89 |
3.8948 |
9.11 |
9.1063829787234 |
$109,813 |
109813.08411215 |
|
 Clayton Richard
 |
Richard Clayton |
RP |
$423,700 |
423700 |
1.12% |
1.12 |
1.86 |
1.858 |
4.39 |
4.3851781921171 |
$228,041 |
228040.90419806 |
|
 Edward Mujica
 |
Mujica Edward |
RP |
$419,800 |
419800 |
1.11% |
1.11 |
2.01 |
2.00561 |
4.78 |
4.777536922344 |
$209,313 |
209312.87737895 |
|
 Tony Gwynn Jr.
 |
Gwynn Jr. Tony |
CF |
$419,800 |
419800 |
1.11% |
1.11 |
-0.68 |
-0.677247 |
— |
0 |
— |
0 |
|
 Everth Cabrera
 |
Cabrera Everth |
SS |
$418,800 |
418800 |
1.11% |
1.11 |
-0.60 |
-0.598078 |
— |
0 |
— |
0 |
|
 Luke Gregerson
 |
Gregerson Luke |
RP |
$416,500 |
416500 |
1.10% |
1.10 |
2.22 |
2.22348 |
5.34 |
5.338487394958 |
$187,319 |
187318.97745876 |
|
 Nick Hundley
 |
Hundley Nick |
C |
$415,700 |
415700 |
1.10% |
1.10 |
1.03 |
1.0271 |
2.47 |
2.4707721914842 |
$404,732 |
404731.76905851 |
|
 Tim Stauffer
 |
Stauffer Tim |
RP |
$415,100 |
415100 |
1.10% |
1.10 |
1.78 |
1.7837 |
4.30 |
4.2970368585883 |
$232,719 |
232718.5064753 |
|
 Sean Gallagher
 |
Gallagher Sean |
RP |
$413,500 |
413500 |
1.09% |
1.09 |
-0.70 |
-0.704805 |
— |
0 |
— |
0 |
|
 Will Venable
 |
Venable Will |
RF |
$412,800 |
412800 |
1.09% |
1.09 |
2.85 |
2.85387 |
6.91 |
6.9134447674419 |
$144,646 |
144645.69163977 |
|
 Joe Thatcher
 |
Thatcher Joe |
RP |
$412,700 |
412700 |
1.09% |
1.09 |
1.12 |
1.11812 |
2.71 |
2.7092803489217 |
$369,102 |
369101.7064358 |
|
 Kyle Blanks
 |
Blanks Kyle |
LF |
$410,600 |
410600 |
1.09% |
1.09 |
0.04 |
0.0360373 |
0.09 |
0.087767413541159 |
$11,393,750 |
11393750.364206 |
|
 Oscar Salazar
 |
Salazar Oscar |
PH |
$408,500 |
408500 |
1.08% |
1.08 |
-0.10 |
-0.0971869 |
— |
0 |
— |
0 |
|
 Mat Latos
 |
Latos Mat |
RP |
$407,800 |
407800 |
1.08% |
1.08 |
5.98 |
5.98403 |
14.67 |
14.673933300638 |
$68,148 |
68148.054070585 |
|
 César Ramos
 |
Ramos Cesar |
RP |
$401,300 |
401300 |
1.06% |
1.06 |
0.11 |
0.106187 |
0.26 |
0.26460752554199 |
$3,779,182 |
3779182.0090972 |
|
| Year | Padres payroll |
PR Sort |
Avg payroll |
AvgPR Sort |
Diff |
Diff Sort |
|---|
| 1996 | $2,000,000 | 2000000 | $4,583,416 | 4583416 | $-2,583,416 | -2583416 |
| 1997 | $2,000,000 | 2000000 | $4,892,222 | 4892222 | $-2,892,222 | -2892222 |
| 2000 | $53,816,000 | 53816000 | $56,164,089 | 56164089 | $-2,348,089 | -2348089 |
| 2001 | $37,438,000 | 37438000 | $65,991,638 | 65991638 | $-28,553,638 | -28553638 |
| 2002 | $40,678,000 | 40678000 | $68,244,471 | 68244471 | $-27,566,471 | -27566471 |
| 2003 | $43,565,000 | 43565000 | $71,318,479 | 71318479 | $-27,753,479 | -27753479 |
| 2004 | $59,172,333 | 59172333 | $70,466,961 | 70466961 | $-11,294,628 | -11294628 |
| 2005 | $62,186,333 | 62186333 | $73,264,780 | 73264780 | $-11,078,447 | -11078447 |
| 2006 | $69,170,167 | 69170167 | $79,051,754 | 79051754 | $-9,881,587 | -9881587 |
| 2007 | $58,571,067 | 58571067 | $83,931,138 | 83931138 | $-25,360,071 | -25360071 |
| 2008 | $74,010,117 | 74010117 | $90,812,373 | 90812373 | $-16,802,256 | -16802256 |
| 2009 | $44,173,200 | 44173200 | $91,093,211 | 91093211 | $-46,920,011 | -46920011 |
| 2010 | $37,799,300 | 37799300 | $93,373,681 | 93373681 | $-55,574,381 | -55574381 |
| 2011 | $45,869,140 | 45869140 | $96,102,034 | 96102034 | $-50,232,894 | -50232894 |
| 2012 | $55,621,900 | 55621900 | $100,657,138 | 100657138 | $-45,035,238 | -45035238 |
| 2013 | $68,333,600 | 68333600 | $109,024,990 | 109024990 | $-40,691,390 | -40691390 |
| 2014 | $90,636,600 | 90636600 | $117,828,782 | 117828782 | $-27,192,182 | -27192182 |
| 2015 | $108,387,033 | 108387033 | $127,404,244 | 127404244 | $-19,017,211 | -19017211 |
| 2016 | $100,509,500 | 100509500 | $132,219,407 | 132219407 | $-31,709,907 | -31709907 |
| 2017 | $67,624,400 | 67624400 | $137,302,894 | 137302894 | $-69,678,494 | -69678494 |
| 2018 | $94,037,733 | 94037733 | $136,929,168 | 136929168 | $-42,891,435 | -42891435 |
| 2019 | $100,804,100 | 100804100 | $136,944,257 | 136944257 | $-36,140,157 | -36140157 |
| 2020 | $151,461,550 | 151461550 | $140,677,788 | 140677788 | $10,783,762 | 10783762 |
| 2021 | $171,488,220 | 171488220 | $132,162,631 | 132162631 | $39,325,589 | 39325589 |
| 2022 | $212,846,719 | 212846719 | $149,374,046 | 149374046 | $63,472,673 | 63472673 |
| 2023 | $221,599,740 | 221599740 | $160,460,390 | 160460390 | $61,139,350 | 61139350 |
| 2024 | $153,892,054 | 153892054 | $135,504,022 | 135504022 | $18,388,032 | 18388032 |
| 2025 | $150,295,454 | 150295454 | $96,417,302 | 96417302 | $53,878,152 | 53878152 |
| 2026 | $137,745,454 | 137745454 | $76,694,120 | 76694120 | $61,051,334 | 61051334 |
| 2027 | $156,495,454 | 156495454 | $58,935,617 | 58935617 | $97,559,837 | 97559837 |
| 2028 | $124,545,454 | 124545454 | $45,437,759 | 45437759 | $79,107,695 | 79107695 |
| 2029 | $113,545,454 | 113545454 | $37,269,628 | 37269628 | $76,275,826 | 76275826 |
| 2030 | $113,545,454 | 113545454 | $39,665,769 | 39665769 | $73,879,685 | 73879685 |
| 2031 | $101,259,739 | 101259739 | $38,360,152 | 38360152 | $62,899,587 | 62899587 |
| 2032 | $101,259,739 | 101259739 | $47,925,459 | 47925459 | $53,334,280 | 53334280 |
| 2033 | $101,259,739 | 101259739 | $43,068,924 | 43068924 | $58,190,815 | 58190815 |
| 2034 | $36,714,285 | 36714285 | $29,428,571 | 29428571 | $7,285,714 | 7285714 |
|
 2010 San Diego Padres