| Player | Player Sort | Pos | Salary | Salary Sort | Pct | Pct Sort | WARP | WARP Sort | WARP/$M | WARP/$M Sort | $/WARP | $/WARP Sort | Current Status |
|---|
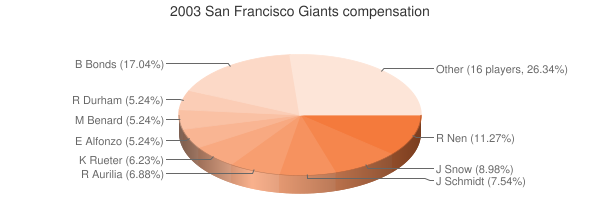
 Barry Bonds
 |
Bonds Barry |
LF |
$15,000,000 |
15000000 |
18.45% |
18.45 |
10.03 |
10.0348 |
0.67 |
0.66898666666667 |
$1,494,798 |
1494798.1026029 |
|
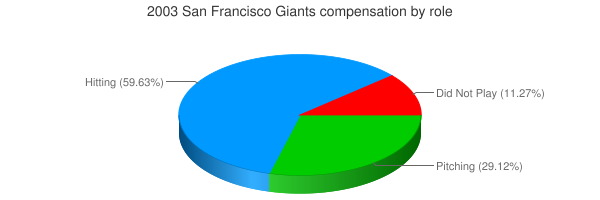
 Robb Nen
 |
Nen Robb |
DNP |
$8,600,000 |
8600000 |
10.58% |
10.58 |
— |
0.00 |
— |
0 |
— |
0 |
|
 J.T. Snow
 |
Snow J.T. |
1B |
$6,850,000 |
6850000 |
8.43% |
8.43 |
1.41 |
1.40685 |
0.21 |
0.2053795620438 |
$4,869,034 |
4869033.6567509 |
|
 Rich Aurilia
 |
Aurilia Rich |
SS |
$6,250,000 |
6250000 |
7.69% |
7.69 |
0.83 |
0.825784 |
0.13 |
0.13212544 |
$7,568,565 |
7568565.1453649 |
|
 Jason Schmidt
 |
Schmidt Jason |
RP |
$5,937,500 |
5937500 |
7.30% |
7.30 |
8.12 |
8.11824 |
1.37 |
1.3672825263158 |
$731,378 |
731377.73704645 |
|
 Kirk Rueter
 |
Rueter Kirk |
RP |
$5,866,667 |
5866667 |
7.22% |
7.22 |
0.38 |
0.38389 |
0.07 |
0.065435791736603 |
$15,282,156 |
15282156.34687 |
|
 Ray Durham
 |
Durham Ray |
2B |
$5,200,000 |
5200000 |
6.40% |
6.40 |
3.67 |
3.66581 |
0.70 |
0.70496346153846 |
$1,418,513 |
1418513.2344557 |
|
 Edgardo Alfonzo
 |
Alfonzo Edgardo |
3B |
$4,000,000 |
4000000 |
4.92% |
4.92 |
0.30 |
0.298515 |
0.07 |
0.07462875 |
$13,399,662 |
13399661.658543 |
|
 Marvin Benard
 |
Benard Marvin |
PH |
$4,000,000 |
4000000 |
4.92% |
4.92 |
-0.25 |
-0.251998 |
— |
0 |
— |
0 |
|
 Felix Rodriguez
 |
Rodriguez Felix |
RP |
$3,000,000 |
3000000 |
3.69% |
3.69 |
0.32 |
0.316523 |
0.11 |
0.10550766666667 |
$9,477,984 |
9477984.2223156 |
|
 Jose Cruz
 |
Cruz Jose |
RF |
$2,500,000 |
2500000 |
3.07% |
3.07 |
4.34 |
4.33863 |
1.74 |
1.735452 |
$576,219 |
576218.76029991 |
|
 Jason Christiansen
 |
Christiansen Jason |
RP |
$2,200,000 |
2200000 |
2.71% |
2.71 |
0.36 |
0.363678 |
0.17 |
0.16530818181818 |
$6,049,307 |
6049307.3543079 |
|
 Tim Worrell
 |
Worrell Tim |
RP |
$2,000,000 |
2000000 |
2.46% |
2.46 |
1.76 |
1.75769 |
0.88 |
0.878845 |
$1,137,857 |
1137857.073773 |
|
 Marquis Grissom
 |
Grissom Marquis |
CF |
$1,750,000 |
1750000 |
2.15% |
2.15 |
1.58 |
1.5841 |
0.91 |
0.9052 |
$1,104,728 |
1104728.2368537 |
|
 Damian Moss
 |
Moss Damian |
RP |
$1,550,000 |
1550000 |
1.91% |
1.91 |
-1.07 |
-1.06717 |
— |
0 |
— |
0 |
|
 Neifi Perez
 |
Perez Neifi |
2B |
$1,500,000 |
1500000 |
1.84% |
1.84 |
0.52 |
0.515215 |
0.34 |
0.34347666666667 |
$2,911,406 |
2911405.9179178 |
|
 Benito Santiago
 |
Santiago Benito |
C |
$1,500,000 |
1500000 |
1.84% |
1.84 |
1.15 |
1.15322 |
0.77 |
0.76881333333333 |
$1,300,706 |
1300705.8497078 |
|
 Scott Eyre
 |
Eyre Scott |
RP |
$725,000 |
725000 |
0.89% |
0.89 |
0.54 |
0.541291 |
0.75 |
0.74660827586207 |
$1,339,390 |
1339390.4572587 |
|
 Andres Galarraga
 |
Galarraga Andres |
1B |
$500,000 |
500000 |
0.61% |
0.61 |
0.40 |
0.397497 |
0.79 |
0.794994 |
$1,257,871 |
1257871.1285871 |
|
 Ruben Rivera
 |
Rivera Ruben |
CF |
$500,000 |
500000 |
0.61% |
0.61 |
-0.11 |
-0.108687 |
— |
0 |
— |
0 |
|
 Pedro Feliz
 |
Feliz Pedro |
3B |
$325,000 |
325000 |
0.40% |
0.40 |
1.12 |
1.11883 |
3.44 |
3.4425538461538 |
$290,482 |
290482.02139735 |
|
 Chad Zerbe
 |
Zerbe Chad |
RP |
$317,000 |
317000 |
0.39% |
0.39 |
-0.13 |
-0.126064 |
— |
0 |
— |
0 |
|
 Ryan Jensen
 |
Jensen Ryan |
RP |
$317,000 |
317000 |
0.39% |
0.39 |
-0.07 |
-0.0657703 |
— |
0 |
— |
0 |
|
 Yorvit Torrealba
 |
Torrealba Yorvit |
C |
$312,000 |
312000 |
0.38% |
0.38 |
0.50 |
0.500042 |
1.60 |
1.6026987179487 |
$623,948 |
623947.58840257 |
|
 Kurt Ainsworth
 |
Ainsworth Kurt |
RP |
$302,000 |
302000 |
0.37% |
0.37 |
1.52 |
1.5174 |
5.02 |
5.0245033112583 |
$199,025 |
199024.64742322 |
|
 Joe Nathan
 |
Nathan Joe |
RP |
$300,000 |
300000 |
0.37% |
0.37 |
2.02 |
2.01926 |
6.73 |
6.7308666666667 |
$148,569 |
148569.27785426 |
|
| Year | Giants payroll |
PR Sort |
Avg payroll |
AvgPR Sort |
Diff |
Diff Sort |
|---|
| 2000 | $53,342,826 | 53342826 | $55,368,142 | 55368142 | $-2,025,316 | -2025316 |
| 2001 | $63,289,167 | 63289167 | $64,937,084 | 64937084 | $-1,647,917 | -1647917 |
| 2002 | $78,514,835 | 78514835 | $67,238,672 | 67238672 | $11,276,163 | 11276163 |
| 2003 | $81,302,167 | 81302167 | $70,654,480 | 70654480 | $10,647,687 | 10647687 |
| 2004 | $80,400,833 | 80400833 | $69,466,729 | 69466729 | $10,934,104 | 10934104 |
| 2005 | $88,848,833 | 88848833 | $74,114,841 | 74114841 | $14,733,992 | 14733992 |
| 2006 | $90,017,671 | 90017671 | $79,621,815 | 79621815 | $10,395,856 | 10395856 |
| 2007 | $89,691,052 | 89691052 | $85,537,470 | 85537470 | $4,153,582 | 4153582 |
| 2008 | $75,877,000 | 75877000 | $92,003,799 | 92003799 | $-16,126,799 | -16126799 |
| 2009 | $82,566,450 | 82566450 | $92,169,598 | 92169598 | $-9,603,148 | -9603148 |
| 2010 | $97,023,833 | 97023833 | $94,342,601 | 94342601 | $2,681,232 | 2681232 |
| 2011 | $118,198,333 | 118198333 | $96,974,710 | 96974710 | $21,223,623 | 21223623 |
| 2012 | $131,980,298 | 131980298 | $100,947,217 | 100947217 | $31,033,081 | 31033081 |
| 2013 | $136,908,777 | 136908777 | $108,586,966 | 108586966 | $28,321,811 | 28321811 |
| 2014 | $149,439,474 | 149439474 | $117,131,361 | 117131361 | $32,308,113 | 32308113 |
| 2015 | $173,179,277 | 173179277 | $126,168,161 | 126168161 | $47,011,116 | 47011116 |
| 2016 | $172,086,611 | 172086611 | $131,756,569 | 131756569 | $40,330,042 | 40330042 |
| 2017 | $180,822,611 | 180822611 | $136,337,445 | 136337445 | $44,485,166 | 44485166 |
| 2018 | $200,505,278 | 200505278 | $135,360,600 | 135360600 | $65,144,678 | 65144678 |
| 2019 | $170,179,653 | 170179653 | $134,792,134 | 134792134 | $35,387,519 | 35387519 |
| 2020 | $155,190,747 | 155190747 | $139,496,467 | 139496467 | $15,694,280 | 15694280 |
| 2021 | $149,344,778 | 149344778 | $130,712,288 | 130712288 | $18,632,490 | 18632490 |
| 2022 | $166,189,000 | 166189000 | $149,802,695 | 149802695 | $16,386,305 | 16386305 |
| 2023 | $189,262,500 | 189262500 | $161,692,345 | 161692345 | $27,570,155 | 27570155 |
| 2024 | $189,387,903 | 189387903 | $136,306,249 | 136306249 | $53,081,654 | 53081654 |
| 2025 | $135,000,000 | 135000000 | $98,329,527 | 98329527 | $36,670,473 | 36670473 |
| 2026 | $93,750,000 | 93750000 | $78,039,273 | 78039273 | $15,710,727 | 15710727 |
| 2027 | $35,500,000 | 35500000 | $60,919,343 | 60919343 | $-25,419,343 | -25419343 |
| 2028 | $24,000,000 | 24000000 | $46,901,712 | 46901712 | $-22,901,712 | -22901712 |
|
 2003 San Francisco Giants