| Player | Player Sort | Pos | Salary | Salary Sort | Pct | Pct Sort | WARP | WARP Sort | WARP/$M | WARP/$M Sort | $/WARP | $/WARP Sort | Current Status |
|---|
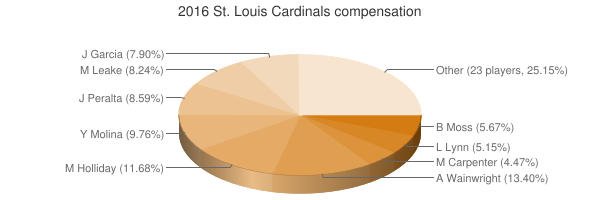
 Adam Wainwright
 |
Wainwright Adam |
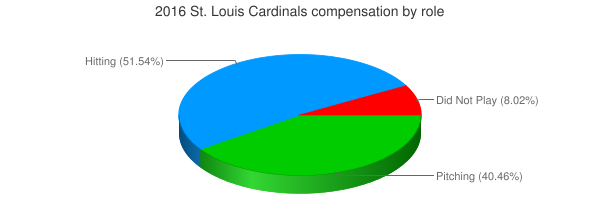
SP |
$19,500,000 |
19500000 |
13.40% |
13.40 |
3.29 |
3.29335 |
0.17 |
0.16888974358974 |
$5,921,023 |
5921022.6668893 |
|
 Matt Holliday
 |
Holliday Matt |
LF |
$17,000,000 |
17000000 |
11.68% |
11.68 |
1.31 |
1.31126 |
0.08 |
0.077132941176471 |
$12,964,629 |
12964629.440386 |
|
 Yadier Molina
 |
Molina Yadier |
C |
$14,200,000 |
14200000 |
9.76% |
9.76 |
4.50 |
4.49529 |
0.32 |
0.31656971830986 |
$3,158,862 |
3158861.8309386 |
|
 Jhonny Peralta
 |
Peralta Jhonny |
3B |
$12,500,000 |
12500000 |
8.59% |
8.59 |
-0.15 |
-0.154223 |
— |
0 |
— |
0 |
|
 Mike Leake
 |
Leake Mike |
SP |
$12,000,000 |
12000000 |
8.24% |
8.24 |
4.34 |
4.34236 |
0.36 |
0.36186333333333 |
$2,763,474 |
2763474.2398143 |
|
 Jaime García
 |
Garcia Jaime |
SP |
$11,500,000 |
11500000 |
7.90% |
7.90 |
3.24 |
3.24379 |
0.28 |
0.28206869565217 |
$3,545,236 |
3545235.6656874 |
|
 Brandon Moss
 |
Moss Brandon |
1B |
$8,250,000 |
8250000 |
5.67% |
5.67 |
2.29 |
2.28777 |
0.28 |
0.27730545454545 |
$3,606,132 |
3606131.7352706 |
|
 Lance Lynn
 |
Lynn Lance |
DNP |
$7,500,000 |
7500000 |
5.15% |
5.15 |
— |
0.00 |
— |
0 |
— |
0 |
|
 Matt Carpenter
 |
Carpenter Matt |
3B |
$6,500,000 |
6500000 |
4.47% |
4.47 |
4.61 |
4.61412 |
0.71 |
0.70986461538462 |
$1,408,719 |
1408719.3224277 |
|
 Trevor Rosenthal
 |
Rosenthal Trevor |
RP |
$5,600,000 |
5600000 |
3.85% |
3.85 |
-0.20 |
-0.200259 |
— |
0 |
— |
0 |
|
 Jedd Gyorko
 |
Gyorko Jedd |
2B |
$4,000,000 |
4000000 |
2.75% |
2.75 |
3.66 |
3.66384 |
0.92 |
0.91596 |
$1,091,751 |
1091750.731473 |
|
 Jonathan Broxton
 |
Broxton Jonathan |
RP |
$3,750,000 |
3750000 |
2.58% |
2.58 |
0.42 |
0.417426 |
0.11 |
0.1113136 |
$8,983,628 |
8983628.2359029 |
|
 Jordan Walden
 |
Walden Jordan |
DNP |
$3,675,000 |
3675000 |
2.52% |
2.52 |
— |
0.00 |
— |
0 |
— |
0 |
|
 Aledmys Díaz
 |
Diaz Aledmys |
SS |
$2,500,000 |
2500000 |
1.72% |
1.72 |
4.36 |
4.36001 |
1.74 |
1.744004 |
$573,393 |
573393.18029087 |
|
 Seunghwan Oh
 |
Oh Seunghwan |
RP |
$2,500,000 |
2500000 |
1.72% |
1.72 |
2.43 |
2.43073 |
0.97 |
0.972292 |
$1,028,498 |
1028497.6118285 |
|
 Brayan Peña
 |
Pena Brayan |
PH |
$2,500,000 |
2500000 |
1.72% |
1.72 |
-0.19 |
-0.186177 |
— |
0 |
— |
0 |
|
 Matt Adams
 |
Adams Matt |
1B |
$1,650,000 |
1650000 |
1.13% |
1.13 |
2.05 |
2.04768 |
1.24 |
1.2410181818182 |
$805,790 |
805789.96718237 |
|
 Rubén Tejada
 |
Tejada Ruben |
3B |
$1,500,000 |
1500000 |
1.03% |
1.03 |
0.04 |
0.037842 |
0.03 |
0.025228 |
$39,638,497 |
39638496.908197 |
|
 Seth Maness
 |
Maness Seth |
RP |
$1,400,000 |
1400000 |
0.96% |
0.96 |
0.25 |
0.254157 |
0.18 |
0.18154071428571 |
$5,508,406 |
5508406.2213514 |
|
 Kolten Wong
 |
Wong Kolten |
2B |
$1,250,000 |
1250000 |
0.86% |
0.86 |
2.82 |
2.81853 |
2.25 |
2.254824 |
$443,494 |
443493.59417853 |
|
 Eric Fryer
 |
Fryer Eric |
C |
$575,000 |
575000 |
0.40% |
0.40 |
0.38 |
0.375217 |
0.65 |
0.65255130434783 |
$1,532,447 |
1532446.557592 |
|
 Michael Wacha
 |
Wacha Michael |
SP |
$539,000 |
539000 |
0.37% |
0.37 |
1.30 |
1.29601 |
2.40 |
2.4044712430427 |
$415,892 |
415891.85268632 |
|
 Carlos Martínez
 |
Martinez Carlos |
SP |
$539,000 |
539000 |
0.37% |
0.37 |
4.71 |
4.70599 |
8.73 |
8.7309647495362 |
$114,535 |
114534.88001462 |
|
 Kevin Siegrist
 |
Siegrist Kevin |
RP |
$539,000 |
539000 |
0.37% |
0.37 |
0.36 |
0.361869 |
0.67 |
0.67137105751391 |
$1,489,489 |
1489489.2903233 |
|
 Randal Grichuk
 |
Grichuk Randal |
CF |
$520,000 |
520000 |
0.36% |
0.36 |
2.82 |
2.81834 |
5.42 |
5.4198846153846 |
$184,506 |
184505.77290178 |
|
 Stephen Piscotty
 |
Piscotty Stephen |
RF |
$512,500 |
512500 |
0.35% |
0.35 |
3.30 |
3.30488 |
6.45 |
6.4485463414634 |
$155,074 |
155073.70918157 |
|
 Tyler Lyons
 |
Lyons Tyler |
RP |
$512,500 |
512500 |
0.35% |
0.35 |
0.80 |
0.80023 |
1.56 |
1.5614243902439 |
$640,441 |
640440.87324894 |
|
 Tommy Pham
 |
Pham Tommy |
CF |
$510,000 |
510000 |
0.35% |
0.35 |
0.41 |
0.409853 |
0.80 |
0.80363333333333 |
$1,244,349 |
1244348.5835165 |
|
 Mitch Harris
 |
Harris Mitch |
DNP |
$509,000 |
509000 |
0.35% |
0.35 |
— |
0.00 |
— |
0 |
— |
0 |
|
 Greg Garcia
 |
Garcia Greg |
3B |
$507,500 |
507500 |
0.35% |
0.35 |
1.61 |
1.60894 |
3.17 |
3.1703251231527 |
$315,425 |
315425.06246349 |
|
 Jeremy Hazelbaker
 |
Hazelbaker Jeremy |
LF |
$507,500 |
507500 |
0.35% |
0.35 |
0.61 |
0.613636 |
1.21 |
1.2091349753695 |
$827,038 |
827037.52713335 |
|
 Matt Bowman
 |
Bowman Matt |
RP |
$507,500 |
507500 |
0.35% |
0.35 |
1.16 |
1.16152 |
2.29 |
2.2887093596059 |
$436,927 |
436927.47434396 |
|
| Year | Cardinals payroll |
PR Sort |
Avg payroll |
AvgPR Sort |
Diff |
Diff Sort |
|---|
| 1977 | $60,000 | 60000 | $60,000 | 60000 | $0 | 0 |
| 1979 | $75,000 | 75000 | $48,000 | 48000 | $27,000 | 27000 |
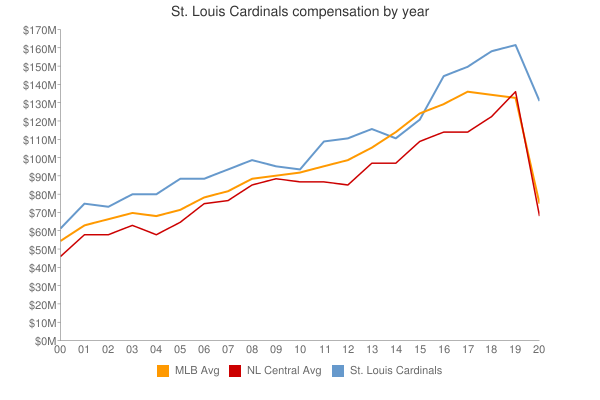
| 2000 | $62,093,023 | 62093023 | $57,491,092 | 57491092 | $4,601,931 | 4601931 |
| 2001 | $76,903,333 | 76903333 | $67,120,750 | 67120750 | $9,782,583 | 9782583 |
| 2002 | $74,425,875 | 74425875 | $69,204,705 | 69204705 | $5,221,170 | 5221170 |
| 2003 | $81,365,000 | 81365000 | $72,156,639 | 72156639 | $9,208,361 | 9208361 |
| 2004 | $81,895,000 | 81895000 | $71,426,357 | 71426357 | $10,468,643 | 10468643 |
| 2005 | $90,948,500 | 90948500 | $73,628,169 | 73628169 | $17,320,331 | 17320331 |
| 2006 | $89,093,658 | 89093658 | $81,192,832 | 81192832 | $7,900,826 | 7900826 |
| 2007 | $94,366,000 | 94366000 | $85,747,487 | 85747487 | $8,618,513 | 8618513 |
| 2008 | $99,865,500 | 99865500 | $93,079,041 | 93079041 | $6,786,459 | 6786459 |
| 2009 | $96,298,500 | 96298500 | $92,957,049 | 92957049 | $3,341,451 | 3341451 |
| 2010 | $94,220,500 | 94220500 | $94,957,956 | 94957956 | $-737,456 | -737456 |
| 2011 | $109,098,000 | 109098000 | $97,426,414 | 97426414 | $11,671,586 | 11671586 |
| 2012 | $111,858,500 | 111858500 | $100,689,500 | 100689500 | $11,169,000 | 11169000 |
| 2013 | $116,505,000 | 116505000 | $106,658,387 | 106658387 | $9,846,613 | 9846613 |
| 2014 | $111,250,000 | 111250000 | $115,428,670 | 115428670 | $-4,178,670 | -4178670 |
| 2015 | $122,066,500 | 122066500 | $125,458,486 | 125458486 | $-3,391,986 | -3391986 |
| 2016 | $145,553,500 | 145553500 | $130,290,910 | 130290910 | $15,262,590 | 15262590 |
| 2017 | $150,152,933 | 150152933 | $136,573,000 | 136573000 | $13,579,933 | 13579933 |
| 2018 | $159,698,667 | 159698667 | $135,681,867 | 135681867 | $24,016,800 | 24016800 |
| 2019 | $162,620,267 | 162620267 | $134,776,225 | 134776225 | $27,844,042 | 27844042 |
| 2020 | $166,101,500 | 166101500 | $138,321,485 | 138321485 | $27,780,015 | 27780015 |
| 2021 | $156,459,167 | 156459167 | $129,635,938 | 129635938 | $26,823,229 | 26823229 |
| 2022 | $140,285,316 | 140285316 | $147,002,411 | 147002411 | $-6,717,095 | -6717095 |
| 2023 | $180,440,183 | 180440183 | $158,155,877 | 158155877 | $22,284,306 | 22284306 |
| 2024 | $155,916,667 | 155916667 | $133,074,721 | 133074721 | $22,841,946 | 22841946 |
| 2025 | $113,906,667 | 113906667 | $94,180,059 | 94180059 | $19,726,608 | 19726608 |
| 2026 | $75,000,000 | 75000000 | $74,818,461 | 74818461 | $181,539 | 181539 |
| 2027 | $38,500,000 | 38500000 | $56,972,319 | 56972319 | $-18,472,319 | -18472319 |
| 2028 | $5,000,000 | 5000000 | $45,437,759 | 45437759 | $-40,437,759 | -40437759 |
|
 2016 St. Louis Cardinals