| Player | Player Sort | Pos | Salary | Salary Sort | Pct | Pct Sort | WARP | WARP Sort | WARP/$M | WARP/$M Sort | $/WARP | $/WARP Sort | Current Status |
|---|
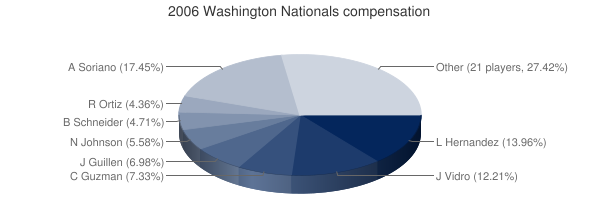
 Alfonso Soriano
 |
Soriano Alfonso |
LF |
$10,000,000 |
10000000 |
15.99% |
15.99 |
7.67 |
7.67477 |
0.77 |
0.767477 |
$1,302,971 |
1302970.6427684 |
|
 Livan Hernandez
 |
Hernandez Livan |
RP |
$8,000,000 |
8000000 |
12.80% |
12.80 |
1.08 |
1.07786 |
0.13 |
0.1347325 |
$7,422,114 |
7422114.1892268 |
|
 Jose Vidro
 |
Vidro Jose |
2B |
$7,000,000 |
7000000 |
11.20% |
11.20 |
0.58 |
0.575647 |
0.08 |
0.082235285714286 |
$12,160,230 |
12160230.141041 |
|
 Cristian Guzman
 |
Guzman Cristian |
DNP |
$4,200,000 |
4200000 |
6.72% |
6.72 |
— |
0.00 |
— |
0 |
— |
0 |
|
 Jose Guillen
 |
Guillen Jose |
RF |
$4,000,000 |
4000000 |
6.40% |
6.40 |
0.48 |
0.483822 |
0.12 |
0.1209555 |
$8,267,503 |
8267503.3380045 |
|
 Brian Lawrence
 |
Lawrence Brian |
DNP |
$3,875,000 |
3875000 |
6.20% |
6.20 |
— |
0.00 |
— |
0 |
— |
0 |
|
 Nick Johnson
 |
Johnson Nick |
1B |
$3,200,000 |
3200000 |
5.12% |
5.12 |
5.98 |
5.98051 |
1.87 |
1.868909375 |
$535,071 |
535071.42367457 |
|
 Brian Schneider
 |
Schneider Brian |
C |
$2,700,000 |
2700000 |
4.32% |
4.32 |
0.37 |
0.371819 |
0.14 |
0.13771074074074 |
$7,261,598 |
7261597.7128657 |
|
 Ramon Ortiz
 |
Ortiz Ramon |
RP |
$2,500,000 |
2500000 |
4.00% |
4.00 |
-0.77 |
-0.774364 |
— |
0 |
— |
0 |
|
 Tony Armas
 |
Armas Tony |
RP |
$2,100,000 |
2100000 |
3.36% |
3.36 |
-0.38 |
-0.377012 |
— |
0 |
— |
0 |
|
 Ryan Drese
 |
Drese Ryan |
RP |
$1,750,000 |
1750000 |
2.80% |
2.80 |
0.07 |
0.0719049 |
0.04 |
0.041088514285714 |
$24,337,702 |
24337701.60309 |
|
 Joey Eischen
 |
Eischen Joey |
RP |
$1,100,000 |
1100000 |
1.76% |
1.76 |
0.18 |
0.17825 |
0.16 |
0.16204545454545 |
$6,171,108 |
6171107.9943899 |
|
 Mike Stanton
 |
Stanton Mike |
RP |
$1,000,000 |
1000000 |
1.60% |
1.60 |
0.31 |
0.307859 |
0.31 |
0.307859 |
$3,248,240 |
3248240.265836 |
|
 Royce Clayton
 |
Clayton Royce |
SS |
$1,000,000 |
1000000 |
1.60% |
1.60 |
1.00 |
1.0046 |
1.00 |
1.0046 |
$995,421 |
995421.0631097 |
|
 Marlon Anderson
 |
Anderson Marlon |
PH |
$925,000 |
925000 |
1.48% |
1.48 |
0.83 |
0.831685 |
0.90 |
0.89911891891892 |
$1,112,200 |
1112199.9314644 |
|
 Matthew Lecroy
 |
LeCroy Matthew |
PH |
$850,000 |
850000 |
1.36% |
1.36 |
0.17 |
0.165033 |
0.19 |
0.19415647058824 |
$5,150,485 |
5150485.0545043 |
|
 Robert Fick
 |
Fick Robert |
C |
$850,000 |
850000 |
1.36% |
1.36 |
-0.48 |
-0.476735 |
— |
0 |
— |
0 |
|
 Marlon Byrd
 |
Byrd Marlon |
CF |
$800,000 |
800000 |
1.28% |
1.28 |
0.80 |
0.800964 |
1.00 |
1.001205 |
$998,796 |
998796.45027742 |
|
 Damian Jackson
 |
Jackson Damian |
CF |
$700,000 |
700000 |
1.12% |
1.12 |
-0.18 |
-0.184761 |
— |
0 |
— |
0 |
|
 Pedro Astacio
 |
Astacio Pedro |
RP |
$700,000 |
700000 |
1.12% |
1.12 |
0.44 |
0.439081 |
0.63 |
0.62725857142857 |
$1,594,239 |
1594238.8761982 |
|
 Daryle Ward
 |
Ward Daryle |
PH |
$700,000 |
700000 |
1.12% |
1.12 |
1.05 |
1.054 |
1.51 |
1.5057142857143 |
$664,137 |
664136.62239089 |
|
 Wiki Gonzalez
 |
Gonzalez Wiki |
C |
$650,000 |
650000 |
1.04% |
1.04 |
0.06 |
0.0564953 |
0.09 |
0.086915846153846 |
$11,505,382 |
11505381.863624 |
|
 Felix Rodriguez
 |
Rodriguez Felix |
RP |
$600,000 |
600000 |
0.96% |
0.96 |
-0.63 |
-0.629136 |
— |
0 |
— |
0 |
|
 Chad Cordero
 |
Cordero Chad |
RP |
$525,000 |
525000 |
0.84% |
0.84 |
1.61 |
1.6132 |
3.07 |
3.0727619047619 |
$325,440 |
325440.1190181 |
|
 John Patterson
 |
Patterson John |
RP |
$450,000 |
450000 |
0.72% |
0.72 |
1.22 |
1.21675 |
2.70 |
2.7038888888889 |
$369,838 |
369837.68235052 |
|
 Gary Majewski
 |
Majewski Gary |
RP |
$352,000 |
352000 |
0.56% |
0.56 |
0.50 |
0.504925 |
1.43 |
1.4344460227273 |
$697,133 |
697133.23760955 |
|
 Chris Booker
 |
Booker Chris |
RP |
$350,000 |
350000 |
0.56% |
0.56 |
0.15 |
0.153651 |
0.44 |
0.43900285714286 |
$2,277,890 |
2277889.5028343 |
|
 Jon Rauch
 |
Rauch Jon |
RP |
$335,000 |
335000 |
0.54% |
0.54 |
1.34 |
1.33831 |
3.99 |
3.9949552238806 |
$250,316 |
250315.69666221 |
|
 Brandon Watson
 |
Watson Brandon |
CF |
$327,000 |
327000 |
0.52% |
0.52 |
-0.47 |
-0.470807 |
— |
0 |
— |
0 |
|
 Michael O'Connor
 |
O'Connor Michael |
RP |
$327,000 |
327000 |
0.52% |
0.52 |
0.17 |
0.169612 |
0.52 |
0.51869113149847 |
$1,927,930 |
1927929.6276207 |
|
 Ryan Zimmerman
 |
Zimmerman Ryan |
3B |
$327,000 |
327000 |
0.52% |
0.52 |
2.36 |
2.36269 |
7.23 |
7.2253516819572 |
$138,402 |
138401.56770461 |
|
 Jason Bergmann
 |
Bergmann Jason |
RP |
$327,000 |
327000 |
0.52% |
0.52 |
0.58 |
0.576921 |
1.76 |
1.7642844036697 |
$566,802 |
566802.04048735 |
Arb2/2011, Arb3/2012, FA/2013 |
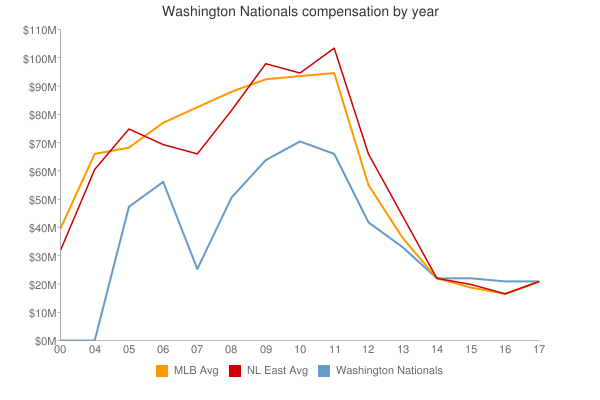
| Year | Nationals payroll |
PR Sort |
Avg payroll |
AvgPR Sort |
Diff |
Diff Sort |
|---|
| 2005 | $48,613,000 | 48613000 | $73,264,780 | 73264780 | $-24,651,780 | -24651780 |
| 2006 | $62,520,000 | 62520000 | $79,051,754 | 79051754 | $-16,531,754 | -16531754 |
| 2007 | $37,347,500 | 37347500 | $83,931,138 | 83931138 | $-46,583,638 | -46583638 |
| 2008 | $56,261,000 | 56261000 | $90,812,373 | 90812373 | $-34,551,373 | -34551373 |
| 2009 | $59,878,000 | 59878000 | $91,093,211 | 91093211 | $-31,215,211 | -31215211 |
| 2010 | $65,275,000 | 65275000 | $93,373,681 | 93373681 | $-28,098,681 | -28098681 |
| 2011 | $70,794,429 | 70794429 | $96,102,034 | 96102034 | $-25,307,605 | -25307605 |
| 2012 | $92,534,929 | 92534929 | $100,657,138 | 100657138 | $-8,122,209 | -8122209 |
| 2013 | $121,289,679 | 121289679 | $109,024,990 | 109024990 | $12,264,689 | 12264689 |
| 2014 | $137,356,579 | 137356579 | $117,828,782 | 117828782 | $19,527,797 | 19527797 |
| 2015 | $162,014,559 | 162014559 | $127,404,244 | 127404244 | $34,610,315 | 34610315 |
| 2016 | $145,178,886 | 145178886 | $132,219,407 | 132219407 | $12,959,479 | 12959479 |
| 2017 | $164,335,444 | 164335444 | $137,302,894 | 137302894 | $27,032,550 | 27032550 |
| 2018 | $180,849,056 | 180849056 | $136,929,168 | 136929168 | $43,919,888 | 43919888 |
| 2019 | $197,203,691 | 197203691 | $136,944,257 | 136944257 | $60,259,434 | 60259434 |
| 2020 | $173,754,795 | 173754795 | $140,677,788 | 140677788 | $33,077,007 | 33077007 |
| 2021 | $172,772,247 | 172772247 | $132,162,631 | 132162631 | $40,609,616 | 40609616 |
| 2022 | $137,371,867 | 137371867 | $149,374,046 | 149374046 | $-12,002,179 | -12002179 |
| 2023 | $125,965,667 | 125965667 | $160,460,390 | 160460390 | $-34,494,723 | -34494723 |
| 2024 | $113,041,666 | 113041666 | $135,504,022 | 135504022 | $-22,462,356 | -22462356 |
| 2025 | $42,875,000 | 42875000 | $96,417,302 | 96417302 | $-53,542,302 | -53542302 |
| 2026 | $40,375,000 | 40375000 | $76,694,120 | 76694120 | $-36,319,120 | -36319120 |
| 2027 | $5,375,000 | 5375000 | $58,935,617 | 58935617 | $-53,560,617 | -53560617 |
| 2028 | $7,375,000 | 7375000 | $45,437,759 | 45437759 | $-38,062,759 | -38062759 |
| 2029 | $9,375,000 | 9375000 | $37,269,628 | 37269628 | $-27,894,628 | -27894628 |
| 2030 | $9,375,000 | 9375000 | $39,665,769 | 39665769 | $-30,290,769 | -30290769 |
|
 2006 Washington Nationals