Editors Note: This article was originally slated to run on Friday, so stats are as of last Thursday. It doesn't change any conclusions for practical purposes.
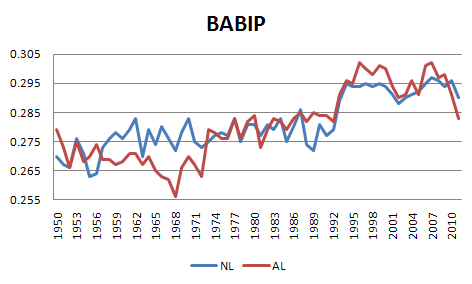
Anyone that has been playing fantasy baseball for a while is quite familiar with the concept of batting average on balls in play. Any time we see a player jump out of the gate with an extremely high or low batting average, we scan the BABIP column on his player page to see how the player is doing in that regard. Traditionally, league average BABIP sites around .290-.310, but as I pointed out last week, the league is trending downward in that regard in recent years.
The aforementioned 20 point range is rather small when you consider the volatility of the BABIP metric. After all, the highest score this season currently belongs to Travis Hafner at .415 while Drew Butera owns the lowest at .174 for all players with at least 100 plate appearances heading into play on Thursday. Still, BABIP does show some patterns as it relates to players’ ages.
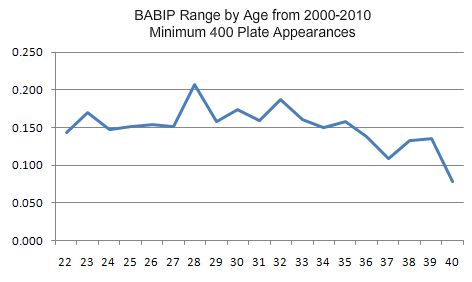
The above graph shows the range between the highest and lowest BABIP at each age for all players with at least 400 plate appearances in a single season between 2000 and 2010. We notice that for older players, the range between the highest and the lowest BABIPs is smaller than for younger players. There are a couple of possible reasons for this. The first is that there are fewer older players than younger players and therefore fewer opportunities for there to be extreme, luck-based BABIPs. Combine this with survivor bias–that is, older players only keep playing if they are reasonably good–and the players with very low true BABIPs go away. Conversely, as players lose bat speed and foot speed as they get older, the highest true BABIPs for older players will be lower than they are for younger players.
The range begins to show decline after age 34 while the largest volatility shows up at age 28 thanks to Manny Ramirez posting a .403 total in 2000. If we remove Ramirez’s total as an outlier, the next highest BABIP is 39 points lower and it belongs to Freddy Sanchez from his career year of 2006. In all, the metric appears to have a slight bump in the traditional prime ages of 27 to 32 and then levels off for the older players as bat and foot speed slowly start to fade away. There certainly can be outliers in that regard, though. After all, Julio Franco maintained a .355 BABIP in his major league career after returning from Japan and Chipper Jones had a .383 BABIP as recently as three seasons ago on his way to a .362 TAv.
The table below breaks down the data from the earlier line graph by age and also shows the 2011 BABIP leader by age.
|
Instances |
Highest |
Lowest |
range |
Player |
2011 BABIP |
|
|
22 |
68 |
0.393 |
0.250 |
0.143 |
Hosmer |
0.340 |
|
23 |
86 |
0.396 |
0.226 |
0.170 |
Morrison |
0.319 |
|
24 |
141 |
0.395 |
0.248 |
0.147 |
Wallace |
0.389 |
|
25 |
187 |
0.379 |
0.227 |
0.152 |
Lucroy |
0.355 |
|
26 |
217 |
0.394 |
0.240 |
0.154 |
Craig |
0.395 |
|
27 |
218 |
0.377 |
0.226 |
0.151 |
Votto |
0.392 |
|
28 |
220 |
0.403 |
0.196 |
0.207 |
Pence |
0.373 |
|
29 |
206 |
0.391 |
0.233 |
0.158 |
Ethier |
0.383 |
|
30 |
196 |
0.399 |
0.225 |
0.174 |
Bautista |
0.338 |
|
31 |
189 |
0.387 |
0.228 |
0.159 |
Holliday |
0.395 |
|
32 |
151 |
0.404 |
0.217 |
0.187 |
Dobbs |
0.400 |
|
33 |
133 |
0.389 |
0.229 |
0.160 |
Byrd |
0.376 |
|
34 |
113 |
0.374 |
0.224 |
0.150 |
Hafner |
0.415 |
|
35 |
92 |
0.386 |
0.228 |
0.158 |
Berkman |
0.326 |
|
36 |
70 |
0.383 |
0.245 |
0.138 |
Guerrero |
0.310 |
|
37 |
42 |
0.337 |
0.228 |
0.109 |
Abreu |
0.358 |
|
38 |
27 |
0.373 |
0.240 |
0.133 |
N/A |
0.000 |
|
39 |
14 |
0.355 |
0.220 |
0.135 |
Mora |
0.286 |
|
40 |
17 |
0.317 |
0.239 |
0.078 |
N/A |
0.000 |
I list the current leaders to put their performance in perspective, but keep in mind that just 40 percent of the way through the season, BABIPs will be more extreme than their end-of-year counterparts. For example, Allen Craig’s .395 BABIP is higher than anything a 26-year old has done in at least 400 plate appearances in the previous ten seasons, and we see the same thing with 31-year old Matt Holliday. The player that really jumps off the page, however, is Travis Hafner, whose .415 BABIP is 39 points higher than the previous high for his age group. Given that Hafner has only hit five home runs in 127 plate appearances this season, he is very likely to cool off at the plate once he returns from injury since he is putting more balls in play than he did in his prime power days.
Fellow elder-statesman Bobby Abreu is in a similar territory as his BABIP is 21 points higher than anyone in his age group over the past ten seasons. Abreu’s power is also down as he has but two home runs this season after hitting 20 in two of the past three seasons, so a likely reduction in his BABIP is going to further drag down his numbers that are already being held back by a struggling Angels offense. In the National League, Greg Dobbs stands out with his .400 BABIP as the majority-side of the third base platoon in Florida, but he had a similar successful season in 2008 in Philadelphia in 240 plate appearances. While Jose Bautista is leading 30-year olds in BABIP this season, his BABIP was only .233 last year as the balls that actually stayed in the park often found a defender’s glove.
For the reasons discussed at the beginning of the article, BABIP surprises are more likely to happen for younger players, which is why a .389 BABIP for Brett Wallace or a .384 BABIP for Matt Joyce is not as surprising as Greg Dobbs and Travis Hafner both posting BABIPs of at least .400 at this point in the season. 13 players have BABIPs of at least .370 heading into Thursday night, and a total of 30 enjoy at least a .350 BABIP. If we look back to just last season at all players that accumulated at least 400 plate appearances, we find just ten players with a BABIP of at least .350 and only four higher than .370. Needless to say, the current group of fortunate hitters will have its numbers trimmed down in the coming weeks and it will not be just Hafner, Abreu, and Dobbs leaving the group.
With a younger player, it is less risky to see if he can be the next outlier for his age group. However, with older players who are far-exceeded their peers such as Hafner, Abreu, Dobbs, Jamey Carroll, and Kosuke Fukudome, it would be wise to start formulating a back-up plan so you can pair up a fading player with one about to surge.
Thank you for reading
This is a free article. If you enjoyed it, consider subscribing to Baseball Prospectus. Subscriptions support ongoing public baseball research and analysis in an increasingly proprietary environment.
Subscribe now
Has the overall HR/FB rate moved much in the last few years? My guess (and I'm too lazy to do the work myself) is that two things contributed - 1- most of the newest ballparks lean toward the pitchers, after an era when most new parks favored hitters, and 2 (more important)- there are more banjo-hitting types now, after an era when there were very few. This has led to an environment that has a lower HR/FB rate MLB-wide (prediction), and thus provided a greater niche for low-K pitchers. I don't know if a lower BABIP is driven by a lower BABIP on fly balls, or - more likely - are a more "organic" - hate that term - outgrowth of the newer, more old-style pitching patterns on display.