This week’s question (actually, it’s an old question, but I’m just now
getting around to answering it) comes from P.W., who writes:
As a Red Sox fan, I enjoy watching the Jimy Williams game of pretending that
everyone is a regular. It got me thinking about lineups and percentages of
playing time that go to a set lineup. Specifically, I’m wondering if have a
set lineup correlates at all with winning. (I believe the pennant-winning
1986 Red Sox had one of the most set lineups in recent history.)
There are a couple of ways that we can think about how "static" a
team’s lineup is over the course of a season:
- How many different lineups are used?
- What teams used the same lineup and batting order the most frequently?
Each of the above options gives a slightly different perspective on the
question, though they are obviously closely related. The first measures the
total amount of lineup juggling (is the manager thrashing around for some
lineup that works?); the latter option considers whether a manager has a
favorite lineup he sticks to whenever possible.
Throughout this discussion, I’ll be looking at the nine-player starting
batting order for American League teams, but will exclude the pitcher for
National League teams, so as not to confuse position-player stability with
rotation or pitching-staff stability. I also exclude (or segregate) strike
years, because fewer games were played and thus fewer lineup cards were
filled out, which helps make perceived stability easier to attain (fewer
opportunities for injuries, etc.). The data span 1978-2000, as I do not have
the detailed information to include 2001 yet
Let’s look at the first definition: the number of different lineups used
over the course of the year:
Team-seasons using the fewest different lineups (non-strike years):
Year Team Lineups1984 Boston Red Sox 42 1993 Atlanta Braves 47 1978 Detroit Tigers 52 1978 Montreal Expos 54 1979 Montreal Expos 54 1985 Toronto Blue Jays 55 1986 Boston Red Sox 55 1982 Philadelphia Phillies 56 1985 St. Louis Cardinals 56 1983 Pittsburgh Pirates 57 1980 Atlanta Braves 58 1992 Toronto Blue Jays 58 1983 Houston Astros 60
Team-seasons using the fewest different lineups (strike years):
Year Team Lineups1981 Cincinnati Reds 42 1981 Philadelphia Phillies 47 1981 Montreal Expos 48 1981 Los Angeles Dodgers 49 1981 Atlanta Braves 51 1981 Chicago White Sox 53 1994 Cleveland Indians 53 1994 Chicago White Sox 54 1994 Los Angeles Dodgers 55 1981 St. Louis Cardinals 57
The 1984 Red Sox and the 1993 Braves were the most extreme when it came to
stable lineups. Just 42 lineups were used by the Red Sox, matching even the
most stable team did during a strike year. The Braves were the only other
full-season team under 50 lineups, with 47.
How did these two teams fare? The Braves won 104 games, the second-highest
total of their 1991-2001 streak run, and won the NL West before losing to
the Phillies in the NLCS. The Red Sox went 86-76, finishing in fourth place
in the seven-team AL East, sandwiched among four teams who won between 85
and 89 games. The Tigers ruled the division and won the World Series.
So, we have one great team and one average team at the extremely stable
side. How about the least stable teams?
Year Team Lineups1985 California Angels 155 1990 California Angels 153 1996 Kansas City Royals 152 1999 Minnesota Twins 152 1979 Oakland Athletics 151 1993 Oakland Athletics 149 1992 Texas Rangers 148 1996 Cincinnati Reds 147 1997 St. Louis Cardinals 146 1992 New York Mets 145 1982 Oakland Athletics 143 1983 California Angels 143 1983 New York Yankees 143 1999 Montreal Expos 143 1989 Minnesota Twins 142 1992 Oakland Athletics 142 1989 Oakland Athletics 141 1990 Kansas City Royals 141 1990 Minnesota Twins 140 1991 Cincinnati Reds 140 2000 Boston Red Sox 140 1979 Baltimore Orioles 140
The 1985 Angels won 90 games and finished in second place by a single game,
while the ’90 Angels went 80-82 and finished fourth. The ’96 Royals won 75
games and finished in last place (fifth). The ’99 Twins lost 97 games and
finished last, and the ’79 Athletics lost a miserable 108 games, finishing
last, 13 games behind second-worst Seattle in the AL West. For the most
part, this is a sad lot of teams, but not exclusively: the ’85 Angels had
the fourth-best record in a 14-team league while setting the gold standard
for lineups used.
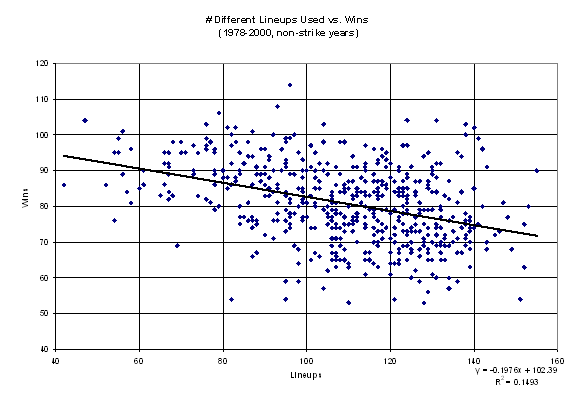
What we really need to do is look at all teams, check their records, and the
number of lineups they’ve used, to see the overall trend. I’ve plotted this
below.

There’s a very slight relationship in which teams that use fewer lineups
tend to win more games. As you can see from the scatter chart, it’s not very
strong, and explains only a portion of variance. Of course, the cause and
effect are important to consider: teams that are healthy and winning have
less incentive to voluntarily change lineups, since what they are doing is
working. It’s the teams who are losing who might as well try something
different, from changing the batting order to taking a look at some
prospects. Injuries will force any team to adapt. Mostly, though, strong
teams lead to using fewer lineups, not vice versa.
Another approach would be to see which teams used the same starting lineup
and batting order the most, and consider how often they won. The following
is a list of teams that started the same position players in the same
batting order 27 or more times.
Year |
Team |
G |
Lineup |
1984 |
Boston Red Sox |
66 |
Wade Boggs Dwight Evans Jim Rice Tony Armas Mike Easler Bill Buckner Rich Gedman Marty Barrett Jackie Gutierrez |
1978 |
Detroit Tigers |
48 |
Ron LeFlore Lou Whitaker Rusty Staub Jason Thompson Steve Kemp Milt May Tim Corcoran Phil Mankowski Alan Trammell |
1990 |
Pittsburgh Pirates |
44 |
Wally Backman Jay Bell Andy Van Slyke Bobby Bonilla Barry Bonds Sid Bream Mike LaValliere Jose Lind |
1983 |
Atlanta Braves |
38 |
Brett Butler Rafael Ramirez Claudell Washington Dale Murphy Bob Horner Chris Chambliss Glenn Hubbard Bruce Benedict |
1998 |
Atlanta Braves |
33 |
Walt Weiss Keith Lockhart Chipper Jones Andres Galarraga Ryan Klesko Javy Lopez Michael Tucker Andruw Jones |
1978 |
Montreal Expos |
30 |
Dave Cash Andre Dawson Ellis Valentine Tony Perez Larry Parrish Warren Cromartie Gary Carter Chris Speier |
1979 |
Pittsburgh Pirates |
30 |
Omar Moreno Tim Foli Dave Parker Willie Stargell John Milner Bill Madlock Ed Ott Phil Garner |
1998 |
Toronto Blue Jays |
30 |
Shannon Stewart Shawn Green Jose Canseco Carlos Delgado Jose Cruz Jr. Tony Fernandez Darrin Fletcher Craig Grebeck Alex S. Gonzalez |
1995 |
Cleveland Indians |
30 |
Kenny Lofton Omar Vizquel Carlos Baerga Albert Belle Eddie Murray Jim Thome Manny Ramirez Paul Sorrento Tony Pena |
1998 |
Philadelphia Phillies |
29 |
Doug Glanville Gregg Jefferies Scott Rolen Rico Brogna Mike Lieberthal Bobby Abreu Mark Lewis Desi Relaford |
1984 |
Chicago Cubs |
28 |
Bob Dernier Ryne Sandberg Gary Matthews Leon Durham Keith Moreland Ron Cey Jody Davis Larry Bowa |
1978 |
Los Angeles Dodgers |
27 |
Davey Lopes Bill Russell Reggie Smith Ron Cey Steve Garvey Dusty Baker Rick Monday Steve Yeager |
1979 |
Montreal Expos |
27 |
Warren Cromartie Rodney Scott Andre Dawson Tony Perez Gary Carter Ellis Valentine Larry Parrish Chris Speier |
Again we see the Ralph Houk’s 1984 Red Sox as an extreme outlier. No other
team in the past 23 years has come close to submitting the same lineup card
66 times in a single season.

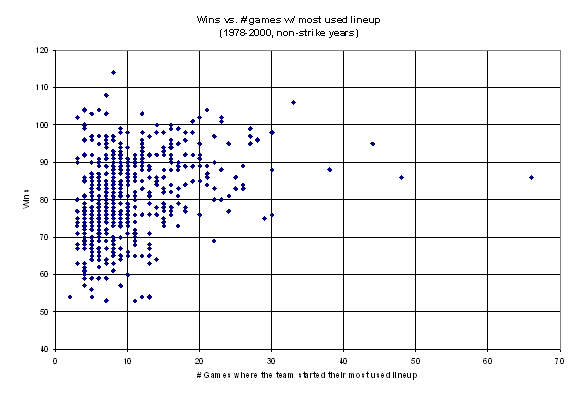
Looking at the above chart, there are a few things to note: It’s rare for a
team that wins fewer than 70 games to stick with one lineup more than 15
times. That makes sense, given the roster shuffling that occurs in an
attempt to find the guys who can play. However, the reverse isn’t true:
successful teams often have constantly changing lineups. Only four teams
that won more than 100 games used the same lineup more than 20 times, while
several more 100-game winners never used one lineup more than 10 times.
Perhaps highly successful teams have managers who can rapidly adapt to
changing circumstances. The statistical analysis of this chart is similarly
uninteresting: just a .112 R^2 value for the linear model.
To summarize, other than a very slight positive tendency between using a set
lineup and winning (in which the causal arrow is most likely: winning
leading to set lineups), there isn’t a very interesting relationship between
lineups and winning. Perhaps the most interesting fact that has come out of
this analysis is how much of an anomaly the 1984 Red Sox were.
Thanks for the question P.W. Remember to keep sending your "Aim For The
Head" questions to kwoolner@baseballprospectus.com.
Keith Woolner is an author of Baseball Prospectus. You can contact him by
clicking here.
Thank you for reading
This is a free article. If you enjoyed it, consider subscribing to Baseball Prospectus. Subscriptions support ongoing public baseball research and analysis in an increasingly proprietary environment.
Subscribe now