You’ve been hanging ’round these parts long enough. You’ve heard the party line, once or twice or 20 times: Higher payrolls don’t result in higher ticket prices. Correlation is not causation. Salaries don’t shift demand curves. It’s Economics 101. Simple, textbook stuff.
The problem with this line of argument–the problem with a lot of economically-based arguments–is that it’s easy to let the theory get ahead of the data. Well, I should state that more precisely: It’s easy to let an oversimplified theory get ahead of the data. A lot of what you learn in Economics 102, and Economics 201, and graduate-level classes that I was too busy drinking Boone’s Farm to take advantage of, is that much of the theory you master in an intro-level class is based on a particular set of assumptions that can prove to be quite robust in certain cases, and utterly misleading in others.
A lot of people shun economics for this very reason–we’ve all had coffee shop conversations with the scruffy, Skynard-mangling philosophy major who is fond of spewing out faux-profundities about the irrationality of human nature. He’s missing the point, of course, but so too is the Ayn Rand-spouting prepster from down the residence hall who conflates assumptions with hard rules.
In either case, a little bit of knowledge is a dangerous thing. Economics, though it sometimes harbors pretensions to the contrary, is above all else a behavioral science, and an empirical science. If the theory doesn’t match the data–well, it’s not the data’s fault. This is especially important to keep in mind when evaluating something like ticket prices to baseball games, a commodity that is unusual in many ways. As we’ve stressed frequently, ticket prices ought to be almost wholly determined by demand-side behavior–the marginal cost of allowing another butt in the seats is negligible. But baseball tickets are unusual in other ways, too: They’re very much a luxury good, and their prices are determined by a finite number of decision-makers who may be subject to conflicts of interest. It’s certainly worth evaluating the available data to see whether we can put our money where our mouth is.
In order to study the question, I looked at time series data for the 15 clubs who have remained in the same ballpark since 1991, excluding expansion teams, and teams who have a more valuable product by virtue of playing in a nicer ballpark. The complete list includes: Anaheim, Boston, Kansas City, Los Angeles, Minnesota, Montreal, Oakland, Philadelphia, St. Louis, San Diego, Toronto, and two teams each in New York and Chicago. All data was gathered from Doug Pappas’ website, with the exception of the 2003 numbers, which are available for free from Team Marketing Report.
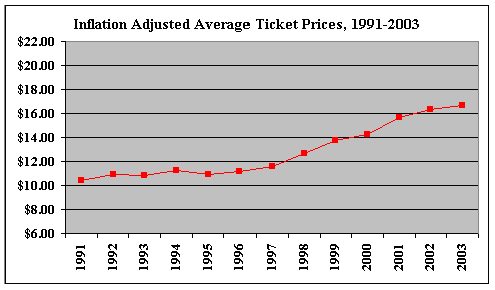
Average ticket prices for the 15 teams in the study, adjusted to 1995 dollars based on the consumer price index, are charted below:

Even among teams that have remained in the same ballpark, average ticket prices have risen much faster than inflation. Since 1993, the increase in real dollar terms is around 55 percent. Throughout the early years of free agency, ticket price increases didn’t much outpace inflation. Beginning around 1997, that pattern began to change.
Well, that’s not a very Prospectusesque conclusion. Have we been wrong this whole time? Does Huckabay have no clothes?
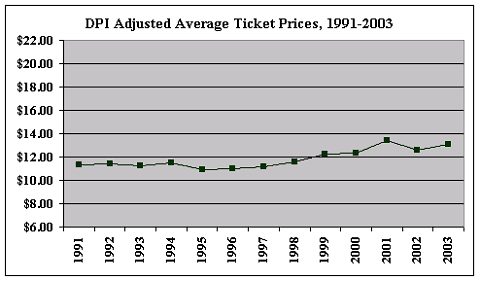
Fortunately, it looks like we’ll be spared from that horrible prospect. The CPI used to calculate inflation is based on a basket of all types of different goods, but as I’ve already mentioned, baseball tickets are unusual. The period around 1997 coincides with a temporary lull in baseball’s labor squabbles, but more importantly, with the beginning of an economic boom that produced a dramatic rise in real wealth. The good folks at the Bureau of Economic Analysis track a statistic called disposable personal income–sometimes referred to as DPI–so let’s see how ticket prices correspond to that metric. Once again, we’ll track things back to 1995, but this time, we’re thinking in terms of 1995 wealth, rather than 1995 dollars.

By this measure, the price increases are revealed to be considerably more moderate–just over 15% within the past 10 years. Because they can be adjusted very easily to anticipated changes in demand, baseball ticket prices are highly responsive to changes in wealth. Still, it might be argued that even a 15% increase in ticket prices is meaningful. The DPI-adjusted average ticket price has increased, if only marginally, in seven of the past eight years. It’s worth breaking down the data into further detail.
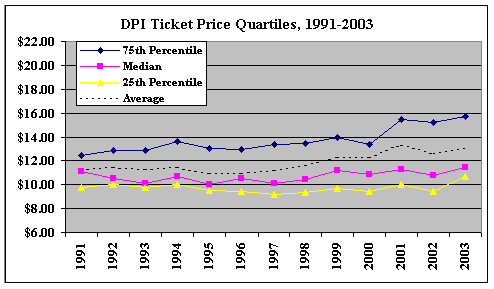
As it happens, the ticket price increase is rather asymmetrical. That is, it has occurred disproportionately in certain locales:

After adjusting for increasing wealth, the median price of baseball tickets has displayed almost no increase at all; but the average price has moved upward because of large increases in a few locations, particularly in large cities like Boston, Chicago, and New York. Between 1991 and 2002, the gap between the 75th percentile and 25th percentile more than doubled, moving from $2.71 in 1991 to $5.80 in 2002, before narrowing a bit in 2003 as the result of price increases in Anaheim and Minneapolis.
This pattern mimics that of the recent economic boom itself. While the strong economic growth of the ’50s and the ’80s was accompanied by flight into the suburbs, the Greenspan years were marked by the revitalization of major cities, especially on the two coasts. Another statistic tracked by the BEA is a comparison of per capita wealth, in particular metropolitan area against the U.S. average. Looking at the top seven areas in terms of per capita wealth provides a virtual who’s who among financially successful baseball teams:
                          Per Capita Income As
                          Percentage of U.S. Average:
                          Top 7 cities as of 2000

Metro Area                1995    2000
--------------------------------------
San Francisco - Oakland    122     141
New York                   126     128
Boston                     117     124
Washington - Baltimore     121     122
Seattle                    109     116
Chicago                    115     114
Denver                     107     113
Even the smaller markets contained on the list–Seattle and Denver–are highly supportive of their baseball teams. All cities on the list but Chicago increased their share of wealth as a percentage of the U.S. average between 1995 and 2000. Far more so than most other forms of popular entertainment, baseball relies on upper-income citizens to keep its turnstiles clicking. (Memo to B.A. Selig: You might really want to reconsider your aversion to moving a team into Washington, D.C. Its wealth index far outpaces that of Portland (99), Las Vegas (91), and San Antonio (80). Let’s not even talk about San Juan.)
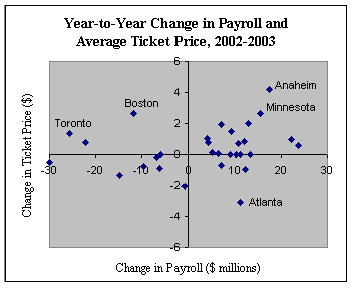
We’ve gotten pretty far removed from the original question. Forget what the theory says–does the empirical data suggest that changes in ticket prices increases are triggered by changes in payroll? In order to investigate, I compared changes in average ticket prices between 2002 and 2003 to changes in Opening Day payrolls.
Next slide, please.

The data here is instructive. At least in the most recent year, there was almost no relationship between changes in payrolls and changes in ticket prices. When regressed against change in ticket prices, change in salary explained only 3.5% of the variance–not a statistically significant result. Even the outliers I’ve highlighted help to tell the story:
- Boston: Lowered its Opening Day payroll by more than $10 million, but brought in Theo Epstein, plays in a wealthy market, and entered the year with expectations as high as ever. Ticket prices were increased again.
- Toronto: New management dramatically reduced its payroll, but put what it expected would be a very competitive team on the field. Slight increase in ticket prices.
- Atlanta: Payroll increased as a result of arbitration paydays, but ticket prices were decreased markedly as a result of an aging club in a saturated market.
- Anaheim and Minnesota: Marked increase in both ticket prices and payroll, but also coming off unexpected on-field success in 2002.
Contrary to all appearances, I did not conduct this research with the single-minded aim to lend support to our old refrain about the lack of a causal link between payroll and ticket prices. As my rather pretentious introduction should suggest, I think the question is considerably more complicated than it’s been given credit for. Teams need to set ticket prices prior to the start of the season, and rely on highly imperfect information in doing so. If a team fallaciously awards big contracts to aging players coming off career years, chances are that it fallaciously believes that these players will help it on the field more than they actually will. It may raise ticket prices to higher than optimal levels as a result.
There’s also an institutional reason why teams can be expected to make decisions that aren’t economically optimal. Economic theory suggests that a firm will seek to maximize its profits in the long run. But baseball executives, with their high turnover rates, may be disproportionately concerned with driving up profits in the near term. This may help to explain why ticket prices have increased dramatically as compared to inflation, but much less dramatically as compared to wealth. Catering to higher-end customers in a period of rapid economic growth may be a Faustian bargain, as it increases near-term cash flows but erodes support among working class segments of the fan base who may be important to a team’s success in the longer term. This is especially true given that baseball allegiances are often strongly determined by familial affiliations, and working-class Americans tend to have larger families. I believe the low early-season attendance figures in some traditionally strong baseball communities may partly be a result of this phenomenon. See also: professional boxing.
What is clear, though–both in terms of theory and data–is that teams don’t raise ticket prices as a result of higher payrolls alone. Inefficient decisions are one thing. But even in baseball front offices, irrational decisions are another.
Thank you for reading
This is a free article. If you enjoyed it, consider subscribing to Baseball Prospectus. Subscriptions support ongoing public baseball research and analysis in an increasingly proprietary environment.
Subscribe now