In the medical field, diagnosis is a skill that requires as much art as science. Consider the case of Clayton Kershaw, who was scratched from his anticipated start on BP day at Dodger Stadium due to a hip impingement, with an initial diagnosis that suggested that the ace could be out until May of 2013. Kershaw sought a second opinion from a hip specialist, and eight days later he was lacing up the spikes for a start against the Reds. I had a similar experience when I blew out my shoulder 15 years ago, as the initial diagnosis of “a separated shoulder” failed to identify a torn rotator cuff, requiring a secondary assessment that altered the long-term prognosis for recovery.
Diagnosing the struggles of a major-league pitcher is an imperfect science, considering the lack of reliable data and the multitude of variables that can influence performance. When a pro pitcher is “under the weather,” one evaluator might point toward mechanics as the key symptom while another blames pitch command (though a savvy scout acknowledges the interplay between stuff and mechanics). Other factors may also come into play, including but not limited to pitch sequencing, functional strength, psychology, and luck.
A number of hurlers have suffered a steep fall from their 2011 performances, and though it may be tempting to isolate a few select statistics to pinpoint a cause, the stats provide only a reference point as opposed to a firm diagnosis. An evaluation of stuff and mechanics will potentially reveal a more conclusive explanation for a pitcher's struggles, as the raw components of pitcher effectiveness are more indicative than the cause-and-effect of batter performance. The symptomatology will differ from player to player, and in some cases, even a rigorous analysis will fall short of a satisfactory explanation. In order to gain a fair representation of the changes in the following pitcher deliveries, I compared the mechanics in “typical” starts from each of the past two seasons, utilizing Bill James Game Scores and sticking to median values when choosing which ballgames to analyze. (Stats thru 9/26/12)
Dan Haren
Haren was coming off of a career year in 2011, so a measure of regression was to be expected from the veteran, but the depth of his collapse has been surprising. Haren led the American League with a K-to-walk ratio of 5.8-to-one last season, thanks in part to a career-low walk rate of 1.2 free passes per nine innings. It was the third time that Haren had led his league in the K:BB stat, and his career rate of 3.9 strikeouts per walk is within Schilling territory of True Outcome dominance. At 3.5 K's per walk, his 2012 ratio lies well above the league average, but the mark is his lowest full-season rate since he was wearing the green and gold six year ago. The component stats have gone in the wrong directions in 2012, with a reduced K rate and an elevated walk rate. Meanwhile a 30-point jump in BABIP has buoyed an escalated hit rate. The disappointing performance has been a blow to a team on the cusp of playoff contention, and some indications are that the Angels are concerned enough to be leaning toward declining Haren's $15.5 million option (with a $3.5 million buyout) for next season.
|
Year |
K % |
BB % |
H % |
|||
|
2011 |
238.1 |
3.17 |
20.2% |
3.5% |
22.1% |
.276 |
|
2012 |
165.1 |
4.35 |
18.7% |
5.4% |
25.3% |
.305 |
Haren went to the cut fastball nearly half of the time in 2011, but his cutter prevalence has slipped to 37 percent this year, with an extra dose of sinkers and splitters making up the difference in his 2012 pitch selection. His velocity has dropped across the board, including a 1.5-mph loss on his hardest-thrown pitches, the sinker and four-seam fastball. The splitter has seen a similar drop-off in velo, with a higher strike percentage yet fewer swings-and-misses as compared to 2011. The trend indicates that Haren is not burying the split under the strike zone as well in 2012 as he did last season, and batters are making contact with the pitch more often. The right-hander has dealt with lower-back stiffness on two separate occasions this year, and though such an issue could certainly have a ripple effect on mechanics and stuff, the fact that Haren had multiple recurrences of lower-back stiffness in 2011 makes the role of injury in his performance record hard to pinpoint.
Mechanics Report Cards
|
|
April 17, 2011 |
May 3, 2012 |
|
Balance |
55 |
50 |
|
Momentum |
30 |
30 |
|
Torque |
55 |
50 |
|
Posture |
55 |
50 |
|
Release Distance |
40 |
40 |
|
Repetition |
70 |
60 |
|
GPA |
50.8 |
46.7 |
Though nothing stands out as a major change, there are a number of minor mechanical indicators that help to explain Haren's struggles this season. The most glaring mechanical trend is the distinct pause in Haren's delivery, as he completely halts his momentum and comes to a stop as he reaches maximum leg lift. The strategy is incredibly inefficient, both for the generation of kinetic energy and the repetition of mechanical timing. Most pitchers with such a timing pattern will struggle mightily to repeat the delivery, but the Halo right-hander is the rare exception of a pitcher who has learned to consistently repeat the complicated timing elements of his delivery.
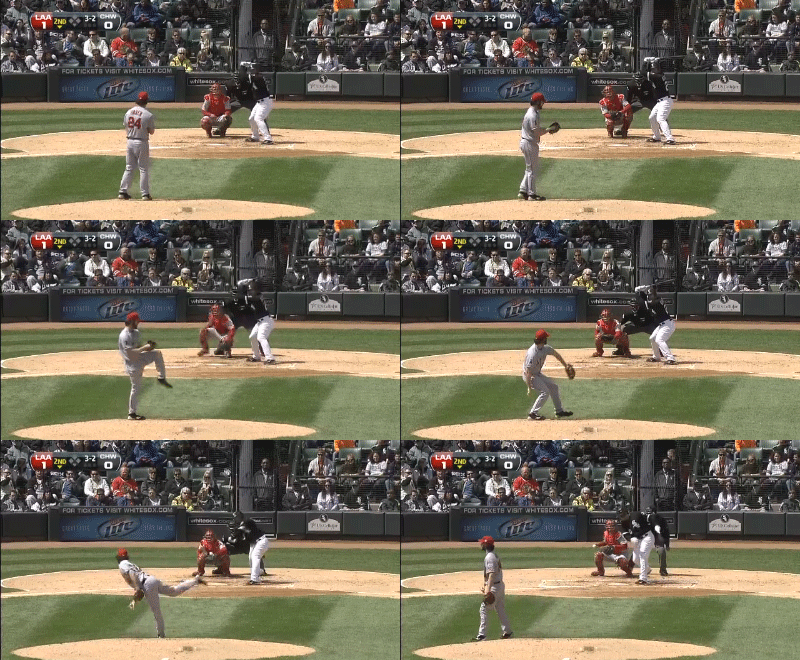
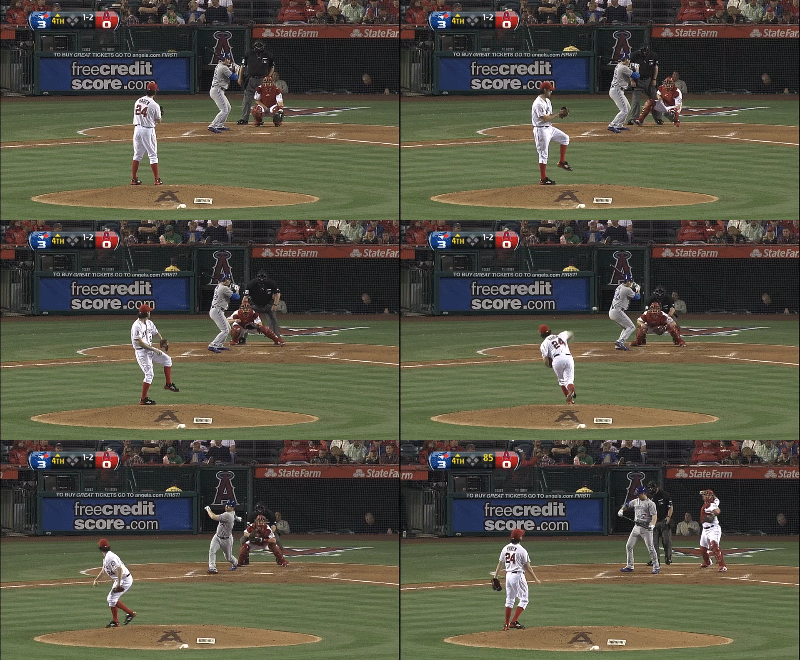
The 31-year old's posture has come and gone over the years, fluctuating from the considerable spine tilt that he exhibited in his Oakland days to the more stable posture that was on display last season. This year, Haren has split the difference while taking a step backward from his efficiency of 2011. The additional spine-tilt has artificially raised his arm-slot by a couple of inches, a factor that could be impairing his ability to keep the splitter under the strike zone. Haren’s balance has taken a hit due to some additional lean toward first base as he reaches max leg lift, as well as a drop-and-drive that is a bit more exaggerated than last season. Finally, his hip-shoulder separation is off a bit due to an earlier trigger of trunk rotation with respect to foot strike, lacking the delay of seasons past that allowed him to reach max velocity.


Tommy Hanson
The buzz coming into spring training was that Hanson had tweaked his mechanics in an effort to use his body more efficiently to throw a baseball, thus reducing the wear-and-tear on his prized right arm. Hanson was coming off of a 2011 season that was abbreviated by an impingement of his throwing shoulder, and the team wisely wanted to protect the long-term value of their investment. The results have not been what the Braves had hoped, with Hanson taking steps backward in virtually every meaningful category on his stat sheet in his age-25 season. The walk rate is a career high, the strikeouts are down, and his BABIP has jumped more than 40 points, the net result of which is an ERA that is nearly a full run higher than last season’s.
|
Year |
K % |
BB % |
H % |
|||
|
2011 |
130.0 |
3.60 |
26.3% |
8.5% |
19.6% |
.271 |
|
2012 |
163.1 |
4.46 |
21.3% |
9.6% |
23.7% |
.315 |
The Braves have babied their fragile young arm as the season winds down, limiting Hanson to just over 89 pitches per start since the All-Star break, an 11-start stretch in which he has escaped the sixth inning on just a single occasion. A steady drop in velocity has haunted Hanson for the past couple of years, with a decline of about 1.5 ticks per season that has turned a former 93-mph pitcher into the 90-mph version of today. A three-mph drop in velo is a surefire recipe for hard contact, and the reduced speeds have coupled with Hanson's issues with pitch command to sap his fastball and slider of their effectiveness. The right-hander is generating fewer called strikes with his primary pitches, and his whiff percentage has declined across the board, underscoring his inability to fool batters in 2012 and suggesting that the BABIP spike is more than a fluke. Hanson has lacked dominance throughout the season, as the pitcher who posted seven different game scores above 70 in 22 starts last year has yet to crack that threshold in any of his 29 turns this year.
Mechanics Report Cards
|
|
April 17, 2011 |
May 7, 2012 |
|
Balance |
60 |
60 |
|
Momentum |
40 |
40 |
|
Torque |
50 |
50 |
|
Posture |
70 |
70 |
|
Release Distance |
50 |
50 |
|
Repetition |
45 |
40 |
|
GPA |
52.5 |
51.7 |
BP fantasy guru Derek Carty offered some sage advice regarding Hanson before the season, warning of the dangers inherent in a pitcher who is toying with his mechanics. The whole article is worth a read, but here's my favorite line from the piece: “If you go and change a guy’s delivery in a non-minor way, other muscles that haven’t been evenly developed may now be relied upon more heavily.” Derek was on target with his analysis, and he was referring to claims that Hanson had eliminated the hitch in his momentum in favor of a more powerful burst to the plate, a strategy that was intended to derive more power from his legs and take some of the stress off of his fragile right shoulder. I was on board with the Braves' intent, but a funny thing happened on the way to April: when the regular season began, Hanson's delivery looked the same as it had the previous year. The hitch was still present, the momentum appeared to be unchanged, and his velocity had dipped even further below his previously established limits.
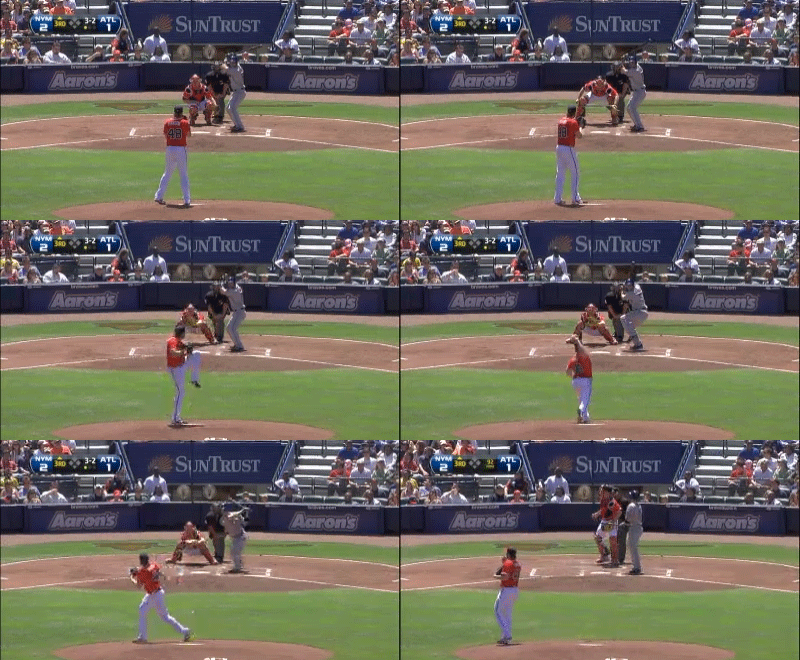
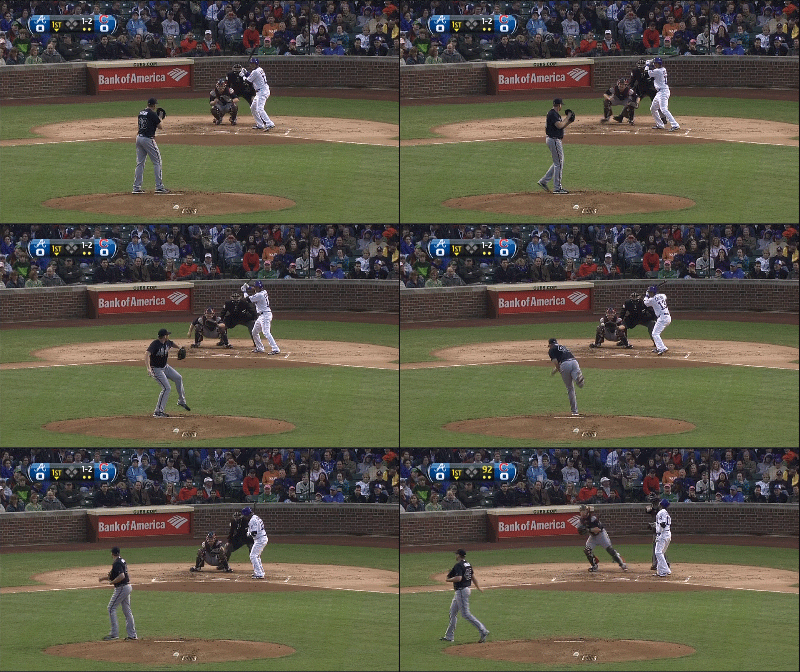
Hanson possesses great balance and excellent posture, yet his delivery contains some other warning signs that provide insight into his struggles this season. The hitch in momentum creates a barrier to repetition of mechanical timing, the key component that supports every pitcher's delivery. Hanson's timing into foot strike is more volatile than in the past, perhaps due in part to the spring training sessions to eliminate the hitch, and his inability to line up the rotational elements has had a ripple effect on pitch velocity as well as command.
Hanson relies on late hip rotation rather than hip-shoulder separation to generate his arm speed, with hips and shoulders that fire nearly in unison, and his otherwise calm motion erupts in violence after foot strike. The right-hander also exhibits some injury red flags with his extremely high angles of shoulder abduction, both at the beginning of trunk rotation (below left) and at release point (below right), the latter of which gives Hanson a high arm-slot despite his minimal spine-tilt. The motion may seem like a natural advantage for downhill plane, yet independent sources have suggested that elevated angles of shoulder abduction at such strategic time-points are potential precursors to injury.


Jon Lester
One of the more surprising mound-implosions of 2012 has occurred in Boston, where Jon Lester has transformed from a reliable number-two starter and occasional Cy Young candidate into a pitcher with a tendency to allow crooked numbers to appear on the scoreboard. His ERA has jumped by a run-and-a-half since last year, with a game log heavily populated by disaster starts, and a strikeout rate that sat above 26 percent in 2009-10 has cratered over the past two seasons. Lester shares a couple of statistical similarities with the other pitchers on this list, including a blown-up BABIP and a shrunken strikeout rate, though his plot is thickened by a reduced walk rate, his finest in three years. The Red Sox collapse is strongly tied to the severe under-performance of the pitching staff, where Lester has actually been the most productive and least expensive of the $50 million quartet that also included Josh Beckett, John Lackey, and Daisuke Matsuzaka.
|
Year |
K % |
BB % |
H % |
|||
|
2011 |
191.2 |
3.47 |
22.8% |
9.4% |
20.8% |
.287 |
|
2012 |
200.1 |
4.94 |
19.3% |
7.9% |
24.4% |
.311 |
There are no caution flags in Lester's velocity numbers via PITCHf/x, with just a 0.1-mph difference between his average velocity values in 2011 and 2012, and his fastball has lost a relatively minor 1.4 mph over the past four years. His pitch selection has also remained relatively stable, as he’s held firm on his frequency of fastballs and curves while trading a handful of cutters for changeups. Lester's home run rate has climbed steadily, and his four-seam fastball has been particularly susceptible to the long ball this season. Lester has been going to the curveball on the first pitch with increasing regularity, up from 15 percent in 2010 to this season's rate of 25 percent, with the tendency to drop a “show me” curve over the plate for strike one. The southpaw is throwing his cut fastball with more velocity this season, up 1.5 mph from 2011, but the reduced velo separation from his four-seamer has made the cutter less effective in generating swing-and-misses.
Mechanics Report Cards
|
|
April 12, 2011 |
August 7, 2012 |
|
Balance |
60 |
60 |
|
Momentum |
50 |
40 |
|
Torque |
55 |
55 |
|
Posture |
60 |
60 |
|
Release Distance |
55 |
45 |
|
Repetition |
45 |
50 |
|
GPA |
54.2 |
51.7 |
Most of the grades were identical when comparing two games that were 16 months apart, with the only exception being a dip in momentum this season. Though it may not be obvious on the first viewing, the delivery from 2011 (top) clocked in at 0.18 seconds faster than the pitch from 2012 (bottom), with a total time of 1.43 seconds from the moment that the front leg lifts off the ground until release point, as compared to 1.61 seconds for the more recent pitch. The 0.18-second difference is significant with respect to one pitcher's time signature, and after a few views, the 2012 version of Lester appears to be almost lazy in executing the delivery when compared to the 2011 counterpart.
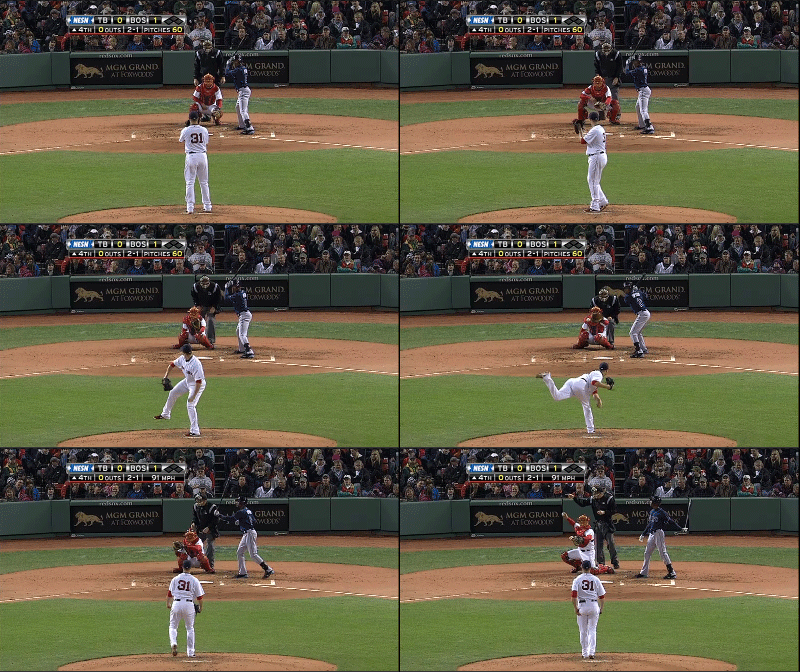
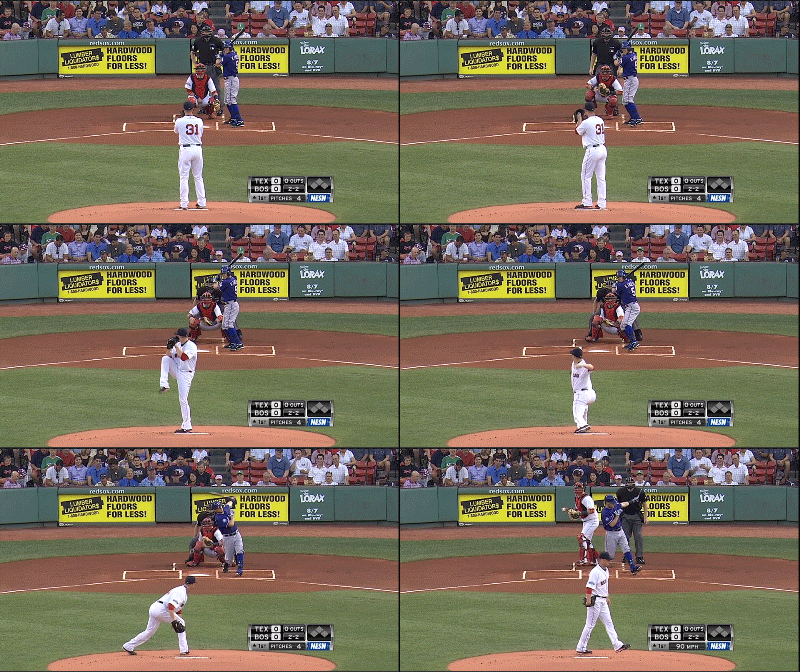
This lethargy has a number of ripple effects with respect to the other elements of Lester's delivery, specifically disrupting the timing and sequencing of the events in the kinetic chain while also robbing the left-hander of precious distance at release point. His release point’s greater distance from the plate will naturally lower the effectiveness of his pitches by decreasing their perceived velocity and allowing batters a longer look, while the decrease in momentum limits the amount of kinetic energy in the delivery.
Ricky Romero
2011 was a breakout year for Romero, who delivered on his promise as the no. 6 overall pick of the 2005 draft and established himself as a cornerstone of a talented young rotation in Toronto. The left-handed Blue Jay was coming off of consecutive seasons of at least 210 innings pitched, and though a pitcher's won-loss record isn't always indicative of his level of talent, Romero's 42-29 standing after his first three years in the bigs reflected his performance. However, all of Romero's stats went haywire in his dismal performance of 2012. His K-rate plummeted, while his proclivity for the free pass reached league-leading heights. His 66-point spike in BABIP is likely a function of fat pitches and missed targets as much as it is regression to the mean.
|
Year |
K % |
BB % |
H % |
|||
|
2011 |
225.0 |
2.92 |
19.4% |
8.7% |
19.2% |
.245 |
|
2012 |
178.0 |
5.76 |
14.9% |
12.7% |
23.6% |
.311 |
The concept of regression to the mean would presuppose a decline in performance from Romero's outlier season of 2011. However, the principle dictates that he would be expected to play closer to his true mean, which based on his track record would suggest a season more similar to his 2010 campaign. Instead, his disaster of 2012 is an outlier on the other side of the performance spectrum. Romero's average fastball velocity is down about 0.8 mph from its 2011 peak, but he is still throwing harder than he did in 2010, so the problem extends far beyond pitch speed.
According to the PITCHf/x classifications, Romero has cut his usage of the sinker in half this season, and he has struggled to locate the strike zone on the rare occasions that he goes to the sink. He has replaced the missing sinkers with four-seam fastballs, yet his groundball rates have remained stable despite the switch. The greatest discrepancy in Romero's stuff-based results is a remarkable decline in whiff percentage, particularly with his changeup, which has dropped nearly eight percentage points from last season.
Mechanics Report Cards
|
|
April 29, 2011 |
June 22, 2012 |
|
Balance |
40 |
50 |
|
Momentum |
60 |
50 |
|
Torque |
50 |
50 |
|
Posture |
30 |
40 |
|
Release Distance |
50 |
50 |
|
Repetition |
40 |
30 |
|
GPA |
45.0 |
45.0 |
Romero's June 22 interleague game against Miami could be considered a turning point in the southpaw's season. He walked away with the victory despite a shaky outing, which was consistent with a season that had gifted Romero with an 8-1 record despite sketchy peripheral stats. The magic would wear off his next start, kicking off a string of 13 consecutive losses across 14 games. Romero’s mechanical profile is convoluted, but like Lester before him, the largest discrepancy from Romero's peak and his pit is centered on momentum and the ripple effects on timing, sequencing, and release distance.
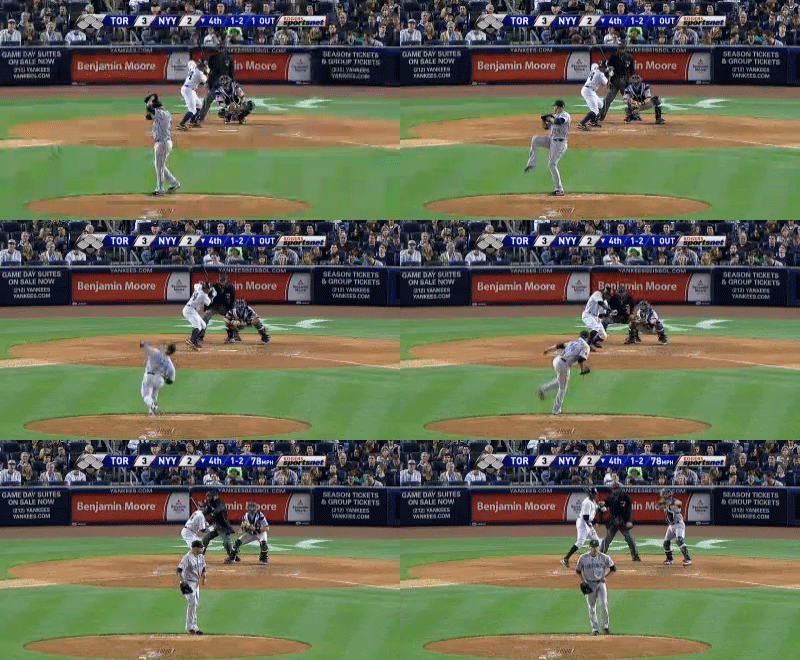
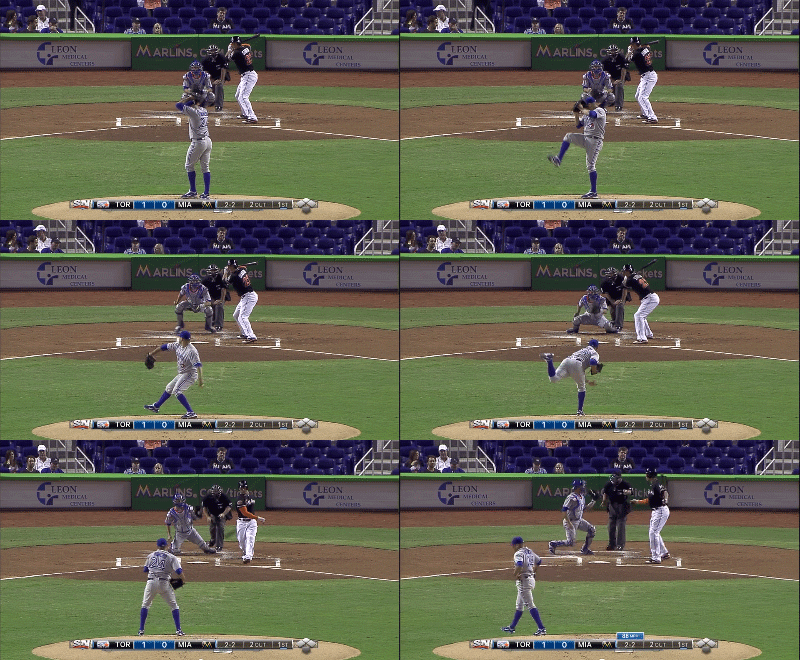
Romero's mechanics report card is a mess of give-and-take, and in some ways, his delivery looks better in 2012 than it did during his breakout. His balance and posture have both improved on the suboptimal levels of 2011, with a less-exaggerated drop-and-drive in addition to spine-tilt that is less severe, providing a more steady foundation for pitch repetition. On the downside is a reduction in momentum, with a Lester-like difference of 0.19 seconds between Romero's 2011 timing pattern and his slower delivery from this season. The impact on his release distance could very well have an impact on his batted-ball stats. With less kinetic energy to control, Romero should theoretically have an easier time repeating his delivery, but in this case, reality does not mesh with expectation, as the lefty's maddening inconsistency has prevailed despite the improved stability.
Special thanks to the incredible PITCHf/x database at brooksbaseball.com, where the new player cards make in-depth analysis incredibly easy. Please click on a player's name to see his BrooksBaseball Card:
Dan Haren
Tommy Hanson
Jon Lester
Ricky Romero
Thank you for reading
This is a free article. If you enjoyed it, consider subscribing to Baseball Prospectus. Subscriptions support ongoing public baseball research and analysis in an increasingly proprietary environment.
Subscribe now
He's owed $7.5 million each year from 2013 until 2015, with a club option for 2016.
Thanks for touching on Romero. Do you think he can be "fixed"?
To answer your question, I controlled for base situation by choosing pitches with nobody on when evaluating momentum and timing. Regarding inning and pitches, I kept to the first few frames in order to avoid issues with fatigue, as you mention. We are dealing with very tight parameters, so I wanted to replicate the environment as closely as possible for these imperfect experiments.
Romero can surely be "fixed," but whether or not that happens depends on coaching, conditioning, and the player's ability to make adjustments.
I also agree that his shoulder is at risk, though it is not the short-arm motion that stands out to me as a threat. The high angles of abduction are red flags, plus his dependence on hip-whip to generate rotational velocity as opposed to hip-shoulder separation is a potential risk factor.