There aren’t many places to hide on a baseball field surrounded by 40,000 spectators, but one place you can enjoy relative anonymity is the coaching box. Most season ticket holders would have a hard time naming their team’s third base coach, never mind the casual fan.
So it isn’t necessarily a good sign that Cubs third base coach Wendell Kim is already well-known in Chicago after having spent just a year there. An even worse sign is that most Cubs fans know Kim best by his nickname: Wavin’ Wendell. Kim’s reputation for sending runners to their deaths at home plate preceded his arrival in Chicago, and it’s only grown since he’s been there.
Of course, reputations can be unfair, and reputations about baserunning in particular are difficult to check, since baserunning numbers don’t show up in the box score or the stats page. So who are the teams who make the most outs at home plate, and elsewhere on the bases?
Here are the top and bottom teams in the majors in getting thrown out on the basepaths in 2003. These numbers include only “Out Stretching”s (OS)–runners thrown out trying for an extra base. That means no caught stealings, no pickoffs, no fielder’s choices (force or non-force), and no runners doubled off on fly balls. The outs are also broken down by the base where the outs were made (when the outs don’t add up, the leftovers are runners thrown out trying to make it back to first after rounding the bag).
                     Outs at
Rk  Team         2nd  3rd  Home       OS
----------------------------------------
1   Pirates       16    9   12        37
2   Cubs           4   11   20        36
3   Indians        9   14   12        35
T4  Devil Rays    10    8   16        34
T4  Reds          14    6   14        34
T4  Yankees        8    9   17        34

...

T25 Mets           4    8   12        24
T25 Rangers        6    5   13        24
27  Blue Jays      6    3   13        23
28  Cardinals      6    5   10        21
29  Padres         8    3    7        19
30  Angels         7    3    7        17
It turns out that Lloyd McClendon’s Pirates, not the Cubs, led the majors in baserunning outs last year. Baserunning has been an issue in Pittsburgh since McClendon took over the team three years ago. After some high-profile baserunning blunders in 2001, he put the team on notice that the baserunning needed to improve before the 2002 season. It worked–that year the Pirates were thrown out stretching only 16 times, the fewest in the majors. But last year the baserunning recklessness returned with a vengeance, moving the team from last to first on the baserunning outs list.
Despite the Cubs’ failure to finish first in overall baserunning outs, the table shows that Kim earned every bit of his “Wavin’ Wendell” reputation, at least last year. While the Pirates made most of their outs at second trying to stretch singles into doubles, the Cubs did most of their damage based on Kim’s decisions, easily leading the majors in outs at home. As a bonus, they finished fourth in outs at third base.
Of course, not all outs are created equal. Having a runner thrown out at home with two outs is less damaging than having that runner thrown out at home with no outs, for example. Rather than looking at the raw number of outs, it might be more illuminating to look at the cost of those outs. To do that, we pull out the run expectation table, and compare the expected runs after the out was made to the expected runs if the runner hadn’t attempted to take the extra base. If that isn’t clear, this article from 2002 has a more detailed description and an example.
Here are 2003’s top and bottom major league teams in the cost of their baserunning outs:
Rk Team          OS     Cost
----------------------------
1  Yankees       34     25.4
2  Devil Rays    34     23.7
3  Diamondbacks  31     23.3
4  Cubs          36     23.0
5  Pirates       37     22.5

...

26 Rangers       24     14.8
27 Mariners      26     13.9
28 Blue Jays     23     11.8
29 Angels        17     11.7
30 Padres        19     10.0
The Yankees had 10 runners gunned down at home with less than two outs last year–a fact that suggests that Willie Randolph may have picked the right time to give up third base coaching and move to the bench. Those 10 outs played a big role in their leading the league in baserunning out cost. At least with the Yankees, you can explain some of it away with the sheer number of runners they had on the basepaths last year: the second-most runners in the majors, behind only the Red Sox. But that excuse doesn’t apply for the unspectacular offenses of the Devil Rays, Diamondbacks, Pirates, and Cubs.
The Cubs had a whopping five runners thrown out at the plate with none out last year. For comparison, almost half the teams in MLB (14 of 30) had none, and 10 others had just one. In one game in Baltimore, Kim sent two separate runners to be thrown out by a mile with none out–the fleet-footed Alex Gonzalez and the speedy Eric Karros, no less. We’ve heard of taking calculated risks, but that’s like playing Russian roulette. With all six chambers loaded.
And what about the individual runners who did the most damage on the basepaths? Here are the players whose baserunning outs cost the most:
Runner          Team  OS  Cost
------------------------------
Rocco Baldelli  TAM    7   5.4
Aubrey Huff     TAM    7   5.2
Jorge Posada    NYY    7   5.0
Alex Sanchez  MIL/DET  7   4.9
Jimmy Rollins   PHI    8   4.7
Rocco Baldelli didn’t lead the league in the raw number of outs–Jimmy Rollins and D’Angelo Jimenez made eight each–but the rookie committed several cardinal baserunning sins during the year that caused his outs to be particularly expensive: He was thrown out at the plate with less than two outs, twice; he made the first out of an inning at third base; and he made the last out of an inning at third base.
There’s something obvious missing from this analysis — the benefit of aggressive base running. If a team takes a lot of risks on the basepaths, they’ll make more outs, sure, but they could also take more extra bases. The value of those extra bases is missing from the Cost columns above.
There’s a reason for that: it’s tough to measure that value. In particular, it’s tough to tell when extra bases are the result of risky baserunning and when they’re the result of power hitting. Is a team that hits a lot of doubles doing it by stretching a lot of singles, or by pounding a lot of balls off the wall? Is a team that scores frequently from first on doubles doing it because of daring baserunning, or because their hitters hit long doubles more often than bloop doubles? These are answerable questions worth further study, but right now we don’t know how to isolate baserunning from hitting in taking extra bases.
What we do know, though, is that the cost of an out usually swamps the benefit of an extra base. There are exceptions (sending a runner home with two outs, for instance), but in most situations making an out costs you two to ten times the benefit of successfully stretching. The mantra we’ve repeated often throughout the years: “Outs are precious. Extra bases are not.” So it’s reasonable to speculate that outs by themselves are telling a good portion of the baserunning story, even if they don’t cover all of it.
With that in mind, teams should be looking to cut down on outs on the basepaths wherever they can. Most teams have been moving in that direction with basestealing, but they haven’t made the corresponding strategy adjustments in other aspects of baserunning:


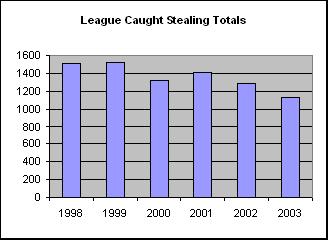
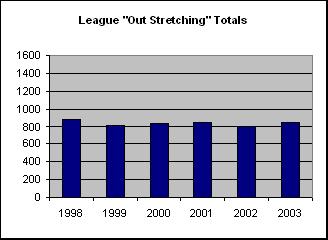
There were almost 500 fewer caught stealings last year than there were just five years ago. On a per-game basis, the caught stealing rate is at its lowest point since 1964. This is a result of teams recognizing the value of their outs, and scaling back risky, often counterproductive, basestealing attempts. But that recognition apparently hasn’t translated to stretching attempts: the number of runners thrown out stretching for extra bases has stayed pretty steady since 1998 (all the years for which I have data).
That highlights an opportunity for smart teams to squeeze out a few extra runs through strategy and coaching. Not a lot–the difference between the worst and the best teams above was only about 15 runs, or about one and a half wins. But one or two wins can make a difference between playing or golfing in October. Teams should spend spring training drilling players in conservative baserunning, especially in situations when the extra base means little. And Wendell Kim? Well, maybe he can spend the spring working on his stop sign.
Thank you for reading
This is a free article. If you enjoyed it, consider subscribing to Baseball Prospectus. Subscriptions support ongoing public baseball research and analysis in an increasingly proprietary environment.
Subscribe now