Are you ready for the “dead ball era” to be over? There’s a chance we’re going to see some more offense in the years to come.
Scoring is up across baseball this year. Not only that, but a number of pitcher-friendly trends have plateaued or even reversed themselves. For the first time in recent memory, strikeouts are decreasing in frequency, and home runs—and runs overall—are increasing for only the second time. Take a look below at first-half numbers from the last six seasons.
|
Season |
BB% |
K% |
BB/K |
HR% |
RA9 |
|||||
|
2010 |
8.7% |
18.2% |
0.48 |
.259 |
.329 |
.406 |
.735 |
.147 |
2.47% |
4.51 |
|
2011 |
8.2% |
18.3% |
0.45 |
.253 |
.319 |
.391 |
.711 |
.139 |
2.33% |
4.20 |
|
2012 |
8.1% |
19.6% |
0.41 |
.254 |
.319 |
.406 |
.725 |
.151 |
2.66% |
4.37 |
|
2013 |
7.8% |
19.8% |
0.40 |
.254 |
.317 |
.401 |
.718 |
.147 |
2.61% |
4.25 |
|
2014 |
7.8% |
20.3% |
0.39 |
.252 |
.316 |
.391 |
.707 |
.139 |
2.33% |
4.15 |
|
2015 |
7.6% |
20.1% |
0.38 |
.253 |
.315 |
.397 |
.712 |
.144 |
2.54% |
4.19 |
The increases are small, and walks are continuing to fall, but I’m tempted to believe the league-wide level of offense is actually higher than last year. After all, it wasn’t long ago that baseball writers began to ponder rule changes to encourage more offense in the game, such as by lowering the pitcher’s mound or continuing to make parks more hitter-friendly. Commissioner Manfred even suggested limiting the use of defensive shifts.
I asked several wise baseball minds why scoring would have increased this year, and none was able to think of a compelling reason. There haven’t been any rule changes that should explain why the balance of forces should start to favor the offense more. Thus, at the risk of being reductionist, I took a look at the team level to see what the nature of the changes in league trends looks like.
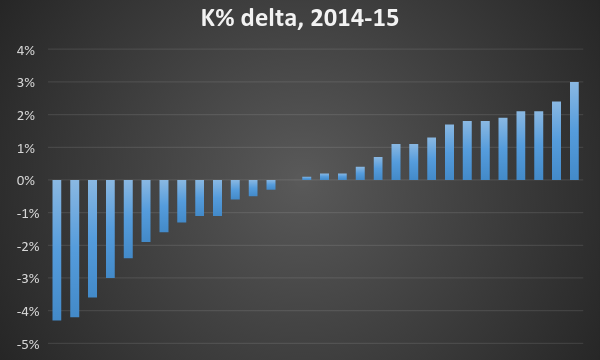
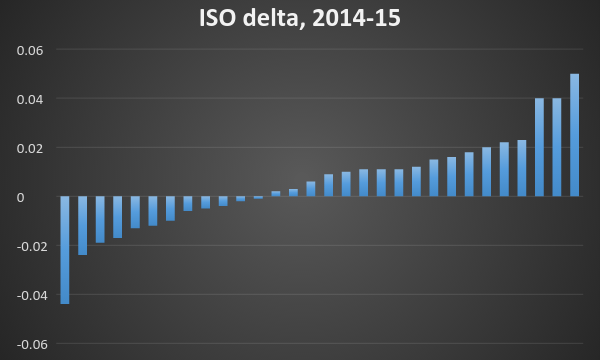
I was most interested in hitters’ strikeout percentage and offensive production, as measured by ISO. Here are team-by-team changes in those two stats from the first half of last year compared to this year so far.

Let’s start with strikeout rate. As you can see, the median change is just about 0. However, a few teams have skewed the mean with huge drop-offs in strikeout rate, two by more than 4 percent of their plate appearances. Those teams are the Braves and the Red Sox. Atlanta, notorious for its high whiff rate in recent years, unloaded several strikeout-prone players since last year’s first half: Dan Uggla, two Uptons, and Jason Heyward. The Red Sox have also lost high-strikeout bats like Will Middlebrooks, Jonny Gomes, Stephen Drew, and David Ross while seldom using Jackie Bradley, Jr.
After those two clubs, most of the changes in strikeout rate even out across the teams. As I expected and feared, the slight decline in strikeout rate is easily described in this reductionist method, but not as easily explained. Without a ready explanation, my instinct is to wait and see before drawing a conclusion about the cause or magnitude of the change.
Now let’s look at extra-base power.

This graph tends to suggest there’s a bit more of a league-wide uptick in power hitting. The median and mean are both positive, more teams are gaining rather than losing ISO, and more teams are gaining by large margins than losing by big margins. The three teams over to the right are the Astros, Dodgers, and Yankees, respectively. The Bronx Bombers have increased their ISO from .129 to .179, a jump precipitated by the healthy returns of Alex Rodriguez and Mark Teixeira, as well as the addition of the rejuvenated Chris Young. The White Sox’s power, at far left on the graph, has cratered with the loss of Adam Dunn and the less-absurd numbers Jose Abreu is putting up this year.
This is still not quite satisfying. Could it be that the talent level as a whole is more prone to power hitting? The Cubs have called up a seemingly endless line of young hitters with power. Joc Pederson is tearing up NL pitching. Other noteworthy young mashers to include are Randal Grichuk, Alex Guerrero, Carlos Correa, Preston Tucker, Steven Souza, Joey Butler, Tim Beckham, Devon Travis, Maikel Franco, Justin Bour, Ben Paulsen, and Mark Canha. Let’s look at rookie batting performance this year vs. the other years in our study. (This is full-year data.)
|
Season |
BB% |
K% |
ISO |
AVG |
OBP |
SLG |
HR% |
|
2010 |
7.8% |
20.9% |
0.126 |
0.246 |
0.310 |
0.373 |
1.95 |
|
2011 |
7.1% |
20.5% |
0.130 |
0.246 |
0.305 |
0.376 |
2.05 |
|
2012 |
6.9% |
21.3% |
0.133 |
0.246 |
0.302 |
0.379 |
2.18 |
|
2013 |
6.7% |
22.5% |
0.119 |
0.241 |
0.297 |
0.360 |
1.92 |
|
2014 |
6.3% |
23.2% |
0.119 |
0.236 |
0.290 |
0.355 |
1.96 |
|
2015 |
7.0% |
24.4% |
0.142 |
0.245 |
0.303 |
0.387 |
2.40 |
Aha! So it appears that the rookie classes in 2013 and 2014 were particularly weak power hitters by recent standards, whereas the 2015 entrants swing heavy sticks. In fact, that .142 ISO and 2.4 percent rate of home runs are the second-highest marks in MLB history, behind only the 2006 rookies.
It’s too soon to tell if the run-scoring environment in baseball has really changed. However, it does certainly seem that the wave of young, talented hitters emerging now has tilted the field back a hair toward the offense. It may be purely conspicuous timing that a few really good young power hitters came up together at just the right time to cause a bump in scoring that will even out after this wave crests. But the rookie class of pitchers this year has been weaker, so far; they’ve posted a 4.10 FIP vs. 3.89 last year.
In studying all of the changes in the hitting-pitching balance over the years, the macro factors such as rule changes and development methods have gotten the most attention. But it’s also worth considering that simple fluctuations in the talent pool will shift what kind of game we enjoy.
Thank you for reading
This is a free article. If you enjoyed it, consider subscribing to Baseball Prospectus. Subscriptions support ongoing public baseball research and analysis in an increasingly proprietary environment.
Subscribe now