The slow free agent season has been controversial. Even after the signings of Yu Darvish and Eric Hosmer, among others, many big-name free agents remain unsigned. Others, like Jarrod Dyson and Todd Frazier, signed for much less than expected. Given baseball owners’ past collusion (not an accusation; legal fact), this raised questions.
My BP colleague Emma Baccellieri wrote a comprehensive article at Deadspin last month entitled, “The MLBPA is Failing Its Players.” In it, she noted that players’ share of baseball revenues has been in a sharp decline since 2002, falling from 56 percent of league revenues then to 40 percent today. This, she asserted, was evidence of the economics of the game becoming increasingly tilted toward the owners, echoing a conclusion voiced by Yahoo Sports’ Jeff Passan earlier.
Last week, former BP editor-in-chief Ben Lindbergh, now at The Ringer, wrote an article entitled, “Baseball’s Economics Aren’t As Skewed As They Seem.” He presented data that, contrary to Baccellieri’s, suggest that players’ share of revenues is not in decline.
This led to predictable reactions online, with those supporting Baccellieri’s view characterized as pro-labor Cassandras and those siding with Lindbergh seen as apologists for rapacious owners. I’d like to weigh in on this, but first, a disclaimer: I know both Baccellieri and Lindbergh. If it sounds as if I’m taking issue with them, it’s because I’ve chosen my words badly. They’re wonderful journalists. Their articles were well-researched, comprehensive, and you should read them.
The question of the percentage of baseball revenues that goes to players has become a lightning rod of sorts in the analytical community. That’s unfortunate. It’s entirely possible for the percentage of a company’s revenues going to labor to fall without management being underhanded. It’s entirely possible for the percentage of a company’s revenues going to labor to be unchanged while management screws its employees. Baccellieri’s article delves into a number of labor-management issues involving baseball, and it’s simplistic to use the percentage-of-revenues argument as the sole evaluative tool.
But let’s look at it. There are two key differences between the calculations that Baccellieri and Lindbergh used.
- Revenues: Baccellieri revised a study done by by FanGraphs’ Nathaniel Grow in 2015. She used a figure from Forbes writer Maury Brown that MLB revenues exceeded $10 billion last year. Lindbergh’s research uses data provided by MLB, and his figure is $1 billion lower.
- Salaries: Baccellieri uses data from the indispensable Cot’s Contracts. Lindbergh’s source is, again, MLB.
The first concern I had in comparing the numbers is data availability. Cot’s uses publicly available sources. I’m pretty confident Cot’s numbers are right. Forbes and MLB’s numbers are proprietary. I can’t review them, and neither can you.
Further, this data are opaque as hell. My day job was as an equities analyst—I analyzed and recommended stocks of publicly-traded companies to investors—and so I’ve seen many, many financial statements. The starting point for reliability is audited financials submitted to the Securities & Exchange Commission (SEC). Even for companies that are SEC filers, audit rules provide a lot of leeway in terms of definition of revenue and expenses. I would always need to talk to the company to get a real picture of what’s going on. MLB isn’t going to open its books to the public, much less to financial analysts. So journalists like Brown have to make (highly) educated guesses, and journalists like Lindbergh have to (ostensibly) take MLB at its word.
But Lindbergh ran the numbers by the union, and the union didn’t raise major objections. Now, it’s possible that the MLBPA is being duped by MLB, but I don’t assign that a high probability. The MLBPA, like any union, employs accountants who can rip apart management’s financial statements. Are owners low-balling revenues by excluding parking, concessions, or TV revenues? Or are they goosing expenses by including salaries for friends and family for no-show jobs or “consulting fees” paid to other companies that the owners control for tax purposes? Nobody without full access to the statements can know for sure, but the union will at least ask the right questions.
The $1 billion difference between the Forbes and MLB revenue figures is mostly due to joint ventures, notably MLB Advanced Media and MLB Network. I’m leaning towards accepting the lower revenue figure. The main reason is that it’s consistent with the figure Forbes uses it when looking at team revenues rather than league-wide revenues. Here are Forbes’ team revenues for 2017.
| Team | 2017 Rev ($mil) |
| NYA | 526 |
| LAN | 462 |
| BOS | 434 |
| CHN | 434 |
| SFN | 428 |
| LAA | 350 |
| NYN | 332 |
| PHI | 325 |
| SLN | 310 |
| WSN | 304 |
| HOU | 299 |
| TEX | 298 |
| SEA | 289 |
| TOR | 278 |
| DET | 275 |
| ATL | 275 |
| CLE | 271 |
| CHA | 269 |
| PIT | 265 |
| SDN | 259 |
| ARI | 253 |
| BAL | 253 |
| MIN | 249 |
| COL | 248 |
| KAN | 246 |
| MIL | 239 |
| CIN | 229 |
| OAK | 216 |
| MIA | 206 |
| TBA | 205 |
| Total | 9,027 |
I’m going to return to the table in a bit, but as you can see, this analysis from Forbes, which looks at team revenues rather than league revenues, sums to slightly more than $9 billion.
The accounting for joint ventures like MLBAM also supports the lower figure. If you care why, you can read this footnote[1]. Basically, joint venture overall revenues are included in the league figures, but each team receives only their proportional share of profits.
As for player salaries, the difference between Cot’s figures and MLB’s are benefits (reported at $421 million in 2017) and postseason shares (reported at $84.5 million). These figures aren’t public, so there’s no way for Cot’s to have them. But they strike me as an accurate representation of teams’ outlays to players.
Again, the degree to which you should buy any of these numbers is the degree to which you can trust them, and we can’t, at least not fully. But they’re the best we have.
***
It appears to me that the Lindbergh/Ringer figures look more defensible. That means player compensation as a percentage of team revenues hasn’t changed much this decade. Does it also mean that it seems to me that players are getting a fair share of overall revenues? No, it does not.
As Lindbergh pointed out in his article, the players’ share of revenues peaked at 63 percent in 2003, compared to about 50 percent today. This figure has been used as a jumping-off point for a pro-management view, noting that baseball’s economics were unstable in 2003, rendering the 63 percent figure equally untenable. There’s some truth to that: If you make the same amount of money in 2018 as you did in 2017, but your employer does a lot better in 2018 than in 2017, your percentage of company revenues will decline. That’s not necessarily a reflection of your boss’ penury, especially if 2017 was an unusually bad year or 2018 was an unusually good one.
So was 2003 an unsustainable outlier? After all, the Expos were being run by the league. Commissioner Bud Selig told the MLBPA that “folding two teams for 2003 remains a priority.” Only two years earlier, MLB threatened to “contract” the Expos and the Twins.
Forbes has team data from 2003. In the table, Val is Forbes’ estimate of franchise value, in millions. 1-yr is the one-year change in franchise value. Growth is the compound annual growth rate of the franchise value since the current ownership acquired it, i.e., the average percentage by which the franchise appreciated each year. (“NA” represent a recent ownership change.) Rev is team revenues, in millions. Op Inc is operating income (earnings before interest, taxes, depreciation, and amortization), in millions. Margin is operating income divided by revenues.
| Team | Val | 1-yr | Growth | Rev | Op Inc | Margin |
| NYA | 832 | (2%) | 15% | 238 | (26.3) | (11.1%) |
| BOS | 533 | 9% | NA | 190 | 11.4 | 6.0% |
| NYM | 442 | (11%) | NA | 158 | (19.3) | (12.2%) |
| LAN | 399 | (11%) | NA | 154 | (19.1) | (12.4%) |
| SEA | 396 | 3% | 10% | 169 | 17.0 | 10.1% |
| ATL | 374 | (12%) | 13% | 156 | (0.3) | (0.2%) |
| SFN | 368 | (4%) | 11% | 153 | 0.7 | 0.5% |
| CHN | 358 | 7% | 13% | 156 | 8.3 | 5.3% |
| HOU | 320 | (2%) | 10% | 128 | (1.9) | (1.5%) |
| SLN | 314 | 2% | 9% | 131 | (11.1) | (8.5%) |
| TEX | 306 | (8%) | 3% | 127 | (28.5) | (22.4%) |
| BAL | 296 | (5%) | 5% | 129 | 9.1 | 7.1% |
| CLE | 292 | (12%) | (2%) | 127 | 10.4 | 8.2% |
| COL | 285 | (6%) | 10% | 124 | (6.3) | (5.1%) |
| PHI | 281 | 18% | 10% | 115 | (12.5) | (10.9%) |
| ARI | 276 | 3% | NA | 126 | (15.2) | (12.1%) |
| SDN | 265 | 17% | 12% | 106 | 4.9 | 4.6% |
| CHA | 248 | 6% | 12% | 124 | 12.8 | 10.3% |
| CIN | 245 | 10% | 6% | 123 | 11.7 | 9.5% |
| LAA | 241 | 7% | NA | 127 | (5.5) | (4.3%) |
| DET | 235 | (1%) | 9% | 117 | 0.3 | 0.3% |
| PIT | 217 | (3%) | 11% | 109 | (0.3) | (0.3%) |
| OAK | 186 | 8% | 9% | 110 | 11.2 | 10.2% |
| MIL | 174 | (16%) | 9% | 102 | 5.1 | 5.0% |
| MIA | 172 | 27% | NA | 101 | (11.6) | (11.5%) |
| KCA | 171 | 12% | 15% | 98 | 6.6 | 6.7% |
| TOR | 169 | 2% | 5% | 99 | – | 0.0% |
| MIN | 168 | 14% | 7% | 99 | (7.1) | (7.2%) |
| TBA | 152 | 4% | 2% | 101 | 7.5 | 7.4% |
| MON | 145 | 29% | NA | 81 | (8.3) | (10.2%) |
| Average | 295 | 3% | 9% | 129 | (1.9) | (1.5%) |
OK, so 2003 was a lousy year. Half of teams lost money, with the average club losing nearly $2 million before interest, taxes, depreciation, and amortization.
But look at the average growth figure. Despite a weak year (and, MLB contended, weak years before that), the average franchise had, at that point, appreciated nine percent per year, every year. That’s a compound growth rate, so franchise values were doubling every eight years. That’s a fantastic investment. Over the prior five years, for example, returns on the Standard & Poor’s 500 stock index were negative.
And here’s the full Forbes data for 2017. All the columns are the same, but this time, for Growth, I’m using the compound annual growth rate for each franchise’s value since 2003.
| Team | Val | 1-yr | Growth | Rev | Op Inc | Margin |
| NYA | 3,700 | 9% | 11% | 526 | 39.0 | 7.4% |
| LAN | 2,750 | 10% | 15% | 462 | (20.5) | (4.4%) |
| BOS | 2,700 | 17% | 12% | 434 | 78.6 | 18.1% |
| CHN | 2,675 | 22% | 15% | 434 | 83.8 | 19.3% |
| SFN | 2,650 | 18% | 15% | 428 | 78.1 | 18.2% |
| NYM | 2,000 | 21% | 11% | 332 | 31.7 | 9.5% |
| SLN | 1,800 | 12% | 13% | 310 | 40.5 | 13.1% |
| LAA | 1,750 | 31% | 15% | 350 | 68.1 | 19.5% |
| PHI | 1,650 | 34% | 13% | 325 | 87.7 | 27.0% |
| WSN | 1,600 | 23% | 19% | 304 | 37.6 | 12.4% |
| TEX | 1,550 | 27% | 12% | 298 | 18.6 | 6.2% |
| ATL | 1,500 | 28% | 10% | 275 | 15.2 | 5.5% |
| HOU | 1,450 | 32% | 11% | 299 | 75.9 | 25.4% |
| SEA | 1,400 | 17% | 9% | 289 | 11.6 | 4.0% |
| CHA | 1,350 | 29% | 13% | 269 | 41.9 | 15.6% |
| TOR | 1,300 | 44% | 16% | 278 | 22.9 | 8.2% |
| PIT | 1,250 | 28% | 13% | 265 | 51.0 | 19.2% |
| DET | 1,200 | 4% | 12% | 275 | (36.4) | (13.2%) |
| BAL | 1,175 | 18% | 10% | 253 | (2.1) | (0.8%) |
| ARI | 1,150 | 24% | 11% | 253 | 47.2 | 18.7% |
| SDN | 1,125 | 26% | 11% | 259 | 22.8 | 8.8% |
| MIN | 1,025 | 13% | 14% | 249 | 29.9 | 12.0% |
| COL | 1,000 | 16% | 9% | 248 | 26.6 | 10.7% |
| KCA | 950 | 10% | 13% | 246 | (0.9) | (0.4%) |
| MIA | 940 | 39% | 13% | 206 | (2.2) | (1.1%) |
| MIL | 925 | 6% | 13% | 239 | 58.2 | 24.4% |
| CLE | 920 | 15% | 9% | 271 | 46.9 | 17.3% |
| CIN | 915 | 1% | 10% | 229 | 15.9 | 6.9% |
| OAK | 880 | 21% | 8% | 216 | 25.5 | 11.8% |
| TBA | 825 | 27% | 13% | 205 | 32.1 | 15.7% |
| Average | 1,537 | 21% | 12% | 301 | 34.2 | 11.4% |
That’s a really different picture. Only four teams didn’t turn a profit. The average franchise appreciated by 21 percent in just one year. The industry’s rolling in dough.
Frankly, you could use these numbers to prove a pro-management or a pro-labor point. Management will say that of course player compensation as a percentage of revenues has declined. The denominator, revenues, was unsustainably low in 2003. It’s risen more rapidly than player salaries because it had to. Labor would retort that nobody went bankrupt in 2003 (and, as I’ve written, it’s entirely consistent for investments to lose money on an operating basis while appreciating nicely overall) and the subsequent explosion in MLB profitability has not been fully shared with the producers of those profits.
So let me do some math. In 2003, when player compensation as a percentage of revenues was at its highest, Forbes pegged total team revenues at $3.88 billion. At 63 percent of team revenues, compensation was $2.44 billion[2]. In 2017, per the MLB data, player compensation was $4.50 billion.
The compound annual growth rate, from $2.44 billion in 2003 to $4.50 billion in 2017, is four percent. Franchise values have increased 12 percent per year, on average, every year for the past 14 years. Revenues have increased six percent per year.
Here are two simple graphs:
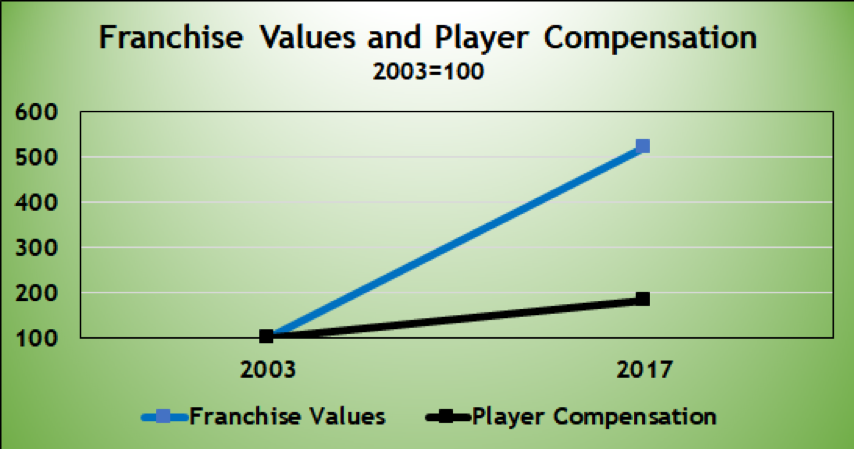
Say we worked at the same company, making $30,000 in 2003. If my salary rose at the same rate as MLB franchise values and yours at the same rate as MLB player compensation, I’d have made $156,000 last year. You’d be at $55,300.
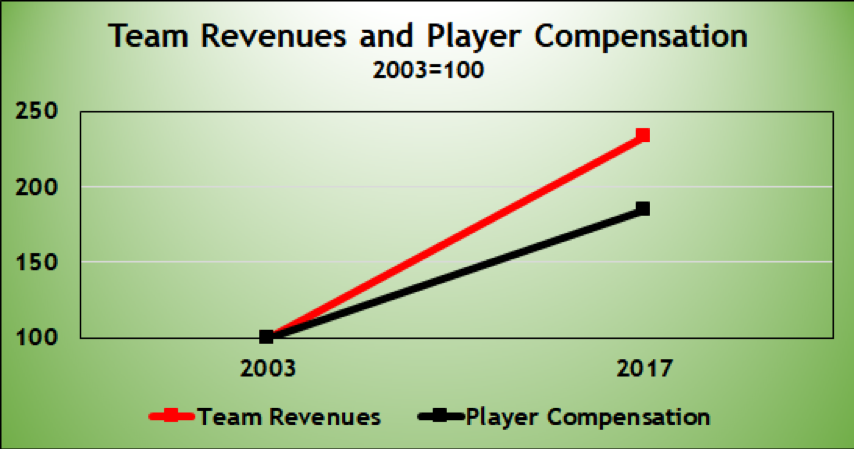
If we both made $30,000 in 2003 and my salary rose at the same rate as team revenues, I’d be making $70,000. If yours rose at the same rate as player compensation, you’d be making 20 percent less.
There’s a lot that goes into that 12 percent average franchise valuation appreciation since 2003. But that’s a really, really large number. That’s way better than the 8.7 percent annualized return on the S&P 500 Index over the same time frame, for example. Keep in mind that private companies aren’t shielded from competition via an antitrust exemption, don’t get to pay their lowest-compensated workers less than the minimum wage, and (usually) don’t get municipalities to build structures for them, pay for infrastructure, and grant them tax abatements. All of those favorable conditions that reduce risk should suggest lower returns for baseball franchises compared to most corporations, not higher.
Maybe the share of MLB team revenues going to players hasn’t declined in recent years. That’s not the same as saying players are getting a commensurate share. Perhaps baseball in 2003 was skating on thin ice, so paying players 63 percent of revenues isn’t viable in the long term. But if one’s going to accept that the percentage of revenues going to labor in lean years is unsustainably high, it also follows that the percentage of revenues going to labor in flush years is unsustainably low. Or, put another way, if the investors in a crony capitalistic, quasi-state-supported industry generate growth rates superior to those of other investors, there’s something screwed up in the economic model, and it’s not the amount of money Scott Boras is trying to get for Jake Arrieta.
[1] Let’s say that you and two of your friends start a website for hamster videos or something. You sell t-shirts and coffee mugs with your site’s logo. You pay a college kid $200 to run the site. You sell $500 worth of shirts and mugs, for which you paid $250. And you attract $100 of advertising. Your total revenues are $600. Your expenses are $450, leaving a profit of $150.
Under accounting rules, each of you will report income of $50, representing your share of the joint venture’s profits, not $200, your share of the joint venture’s revenues. If MLBAM and MLB Network have revenues of $1.3 billion and expenses of $1.0 billion, then each team’s share will be their $10 million (1/30th) share of joint venture profits, not the $43 million share of joint venture revenues. The difference is $1 billion.
[2] In fairness, I don’t know for sure whether this figure includes minor-league player compensation costs. Judging from the source and the context, I don’t think it does. And even if it does, that would account for only 5-6 percent of team revenues. The conclusions would still be valid.
Thank you for reading
This is a free article. If you enjoyed it, consider subscribing to Baseball Prospectus. Subscriptions support ongoing public baseball research and analysis in an increasingly proprietary environment.
Subscribe now