A few weeks ago, when this column first got going, I did a bit of discussion
about park factors, how they’ve
changed, and whether they affect all types of
pitchers equally.
Since then, there have been quite a few people talking about
predictions for the upcoming season, and adjusting for players in new parks is an
essential part of that process. Players like Shawn Green–heading from Los
Angeles to Arizona–are likely to see a boost in their raw numbers despite no
actual gain, or even loss, in their performance. Understanding these changes is
essential to running both fantasy teams and actual teams.
Adjusting for park factors going forward is more difficult than it might seem
for one simple reason: Park factors are not as constant as they should be. Anyone
who used the 2004 Player Forecast Manager and drafted the entire Expos team
understands this problem very well. Nate Silver summed the issue up nicely in
Baseball Prospectus 2005:
Previously, we had worked under the assumption that park factors would
be the same in the upcoming season as they were in the previous season. This seems
like a neutral enough premise, but it ignored the fact that park factors have fluke
seasons, just as ballplayers do.
Certain parks are more difficult to predict than others. Tampa Bay, for
example, has been a rock of stability since it opened in 1998. Its batter park
factor was 104 in 1998, but stayed exactly the same at 100 from 1999-2003 before
dipping to 96 last year. Likewise, Florida was also very steady, notching park
factors of 96, 93, 96, 96, 97, 94, and 95 since 1998. But while the state of
Florida may be very good at keeping its parks steady, several other locales are not.
Here are the parks with the highest standard deviation in park factor since 1998,
excluding cities in which a new park was built.
TEAM         1998  1999  2000  2001  2002  2003  2004  STDEV
Kansas City   104   101   104   110   117   113    95   8.2
Montreal       96   104   100   107   101   118    95   7.9
Colorado      119   129   131   122   121   112   120   6.8
Chicago (N)   103   107    90    96    98    99   106   6.4
Arizona       101    97   102   106   108   111   103   4.9
Texas         104   104   105   100   112   110   111   4.7
Anaheim       101   100   102   107    97    93    99   4.7
There are some reasons for the drastic changes in Kansas City and Montreal. The
Royals moved their fences out prior to 2004 and Montreal added 20 games in San
Juan; regardless, that’s a lot of room for error. Colorado has long held a
dramatic edge on other parks, especially when mentally remembering park factors–yet in 2003 it was a mere 112 after that extreme 131 in 2000. Rather than the
singular outlier to which we’ve all become accustomed, Coors Field was only the
third-most advantageous park to hitters in 2003, following Kansas City and Montreal
and barely edging out Arizona and Texas.
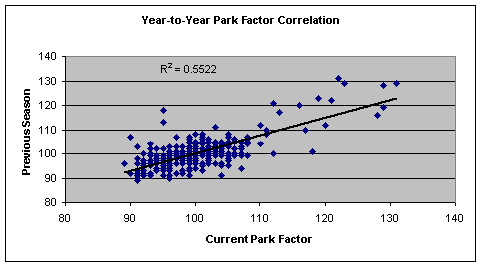
Looking at how each a previous season’s park factor correlates to the current
season over the past 15 years, we see a coefficient of correlation of .5522, strong
enough to be significant, but low enough to raise concerns.

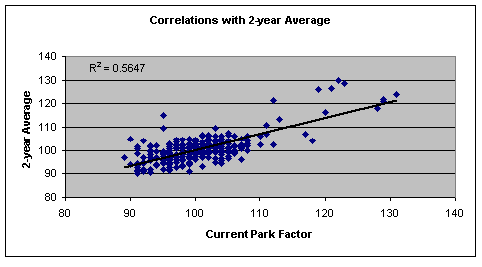
Adding another year to the data could help things, since it will help mitigate
those fluke seasons like Kansas City and Montreal in 2003.

While there is a little improvement, it’s negligible at best. Perhaps we’re
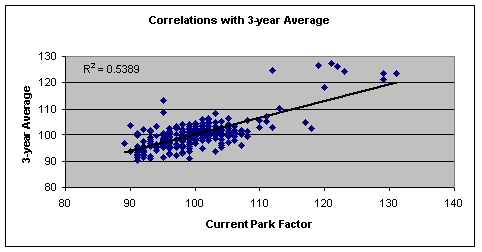
still giving those occasional fluke seasons too much credit. Let’s try three years
worth of data.

Now our correlation has actually dropped from the single-year correlation. It
doesn’t appear that adding additional years to the previous park factor adds any
additional accuracy.
Up until this point, virtually all of the variance in park factors has been
assumed to be a result of sample size issues and noise. On the other hand, when
looking at Kansas City in 2003, there were physical changes associated with the
changing park factor, in this case moving the fences in the outfield.
Looking at all parks since 1990, I’ve added several measures to the analysis.
There are several measures for park size: an average of the distances down the left-field and right-field lines, an average of the power alleys, an average of straightaway center and deepest center, and the distance from home plate to the backstop. These four measures should give us an idea of how big the park is–both in the outfield
and in foul ground–and any changes to the fences. An average height of all
fences in the outfield has been added as well.
Running a multivariable regression using the previous season’s park factor as
well as measures for the size of the ballpark yields a coefficient of correlation
of .5870, barely better than the .5647 we found using the average of the previous two
seasons. Of that 58.7%, 55.5% is explained by the previous year’s park factor;
essentially nothing comes from adding park dimensions to the regression. The
average of straightaway and deepest center and the backstop distance showed more
correlation than other metrics, but those were closer to zero than Mike
Matheny‘s OBP. So while they’re nice to have around, only a gross
misallocation of resources would use them on a full-time basis.
Though many park factors have shown a high degree of variance over the past
10-15 seasons, there are quite a few–Tampa and Florida were mentioned, but also Los
Angeles, St. Louis and Shea Stadium–that are quite stable from year to year.
Still, when you’re looking to gain an edge on your fantasy competitors, be sure to
look back a few years or gather an entire division
of park factors before making any rash decisions: There’s more variance in year-to-year park factors than you may think.
Thank you for reading
This is a free article. If you enjoyed it, consider subscribing to Baseball Prospectus. Subscriptions support ongoing public baseball research and analysis in an increasingly proprietary environment.
Subscribe now