I was recently listening on the radio to a discussion of a team. I don’t recall who was speaking, or the team being discussed—hey, I was driving, couldn’t really take notes—but it concerned a meeting for pitchers before the start of a series against a club. They were going through the opponent’s batters, cataloguing their tendencies. And when they came to the other team’s best hitter, the pitching coach noted, “Don’t let him beat you.”
The implication was, in a key situation, don’t let this hitter have a chance to get a game-deciding hit. Of course, in baseball, that’s less of a worry than in other sports. In a tight game against the Patriots, you can’t very well tell the defense, “Don’t let Tom Brady throw a pass.” You can’t tell a basketball team in the last minutes of a tight game against the Cavaliers, “Don’t let LeBron James get the ball.” In a squeaker against the Capitals, it’s not reasonable to say, “Don’t let Alexander Ovechkin near the puck.”
But if you’re playing the Red Sox and you’ve got a 4-3 lead in the ninth inning, and the three guys due up are Eduardo Nunez, Jackie Bradley, and Christian Vazquez, you’ve got a chance at getting out of the game without Mookie Betts getting to the plate. That being said, “don’t let him beat you” is the kind of thing you hear enough that you wonder whether it’s actually true. Well, you might not, but I do. So I decided to look into it.
First, I had to decide who the him in “don’t let him beat you” is. On some teams, it’s pretty obvious. Joey Votto. Paul Goldschmidt. Mike Trout. On others, though … whom on this year’s Marlins do you want to avoid? Or the Rays? Or even the Dodgers? My first thought was: There isn’t a him on every team. So I decided to limit my search to the top 15 batters—one for every two teams—in the majors for each season of the 30-team era. I based this on our True Average, or TAv.
In 2017, for example, the top 15 per TAv were Mike Trout, Joey Votto, Giancarlo Stanton, Justin Turner, Freddie Freeman, Aaron Judge, Tommy Pham, Charlie Blackmon, Cody Bellinger, Paul Goldschmidt, Kris Bryant, Anthony Rendon, Jose Altuve, Marcell Ozuna, and Zack Cozart. Yes, I know, that’s not perfect (Nolan Arenado? Jose Ramirez? Nelson Cruz? Buster Posey?), but it’s good enough.
If teams are intent on not letting those top hitters beat them, that implies they’re not going to give them good pitches to hit. In 2017, that was effectively saying, “We’ll pitch around Freddie Freeman and take our chances with Matt Kemp,” or “We’ll pitch around Tommy Pham and take our chances with Paul DeJong.” (Good lord, you’d hope that’s what they were doing.) That, in turn, implies that those 15 hims would see their walk rates spike in key situations.
To identify key situations, I used Tom Tango’s Leverage Index, or LI. LI starts with the win expectancy of a plate appearance and considers the potential changes in win expectancy that could occur during the plate appearance. For example, last of the ninth inning, two outs, runner on first, trailing by a run, the win expectancy goes to 0 percent with an out, 100 percent with a home run, and something in between for everything else. The LI formula multiplies each change in win expectancy by its likelihood of occurring and divides the result by the average potential change in win expectancy. It’s scaled to 1.0, so a high-leverage plate appearance like the example above has a Leverage Index greater than 1.0. A ninth-inning plate appearance with a team ahead by eight runs has an LI well below 1.0.
I asked our amazing numbers guy, Rob McQuown, to retrieve the batting statistics for every one of the top 15 batters by TAv over the past 20 years—300 batters in all—in high-leverage situations, defined as a Leverage Index of 1.5 or greater. I compared those figures to their batting statistics in all their other plate appearances and looked for a difference.
Before I show you the results, I want to set the baseline. And that is: Major-league hitters are better in high-leverage situations than they are in other plate appearances.
From 1998 to 2017, hitters had a .261/.327/.417 slash line in non-high-leverage situations. They hit .264/.338/.413 in high-leverage plate appearances. Yeah, they give up a little bit of power for a little bit more on base. But the resulting OPS is seven points higher when the pressure’s on. Over those 20 years, MLB batters had a .263 TAv in high-leverage plate appearances. TAv is scaled to .260, so that’s above average. Our elite 300 hitters had a .339 TAv in high leverage, compared to .333 at other times. (See, I told you clutch hitting isn’t a skill.)
One of the things that does change in high leverage is walk rate. Major-league hitters walked in 9.67 percent of plate appearances in high-leverage plate appearances from 1998 to 2017. They walked in 8.19 percent of other plate appearances. That’s an increase of 1.48 percent. So if the “don’t let him beat you” philosophy is playing out, we should see walk rates for the top hitters that are considerably higher—more than 1.48 percent higher—in high-leverage plate appearances.
And that’s exactly what occurred. In high-leverage situations, the top 15 hitters in the past 20 seasons walked in 15.87 percent of their plate appearances. In other plate appearances, they walked 12.85 percent of the time. That’s a difference of 3.02 percent. Among the 300 hitter seasons, the average difference was 2.98 percent. The median was 2.49 percent. All but 75 of the 300 walked more frequently in high-leverage situations than in others. The best hitters clearly get pitched around when the pressure’s on.
However, that “pitching around” is solely caused by intentional walks. This table summarizes walk rates for the 300 batters in our sample:
| Walk Rate | High LI | Non-High LI | Difference |
| All Walks | 15.87% | 12.85% | +3.02% |
| Intentional | 4.71% | 1.36% | +3.35% |
| Unintentional | 11.16% | 11.49% | -0.33% |
For all batters in high-leverage situations, the walk rate rises 1.48 percent overall, comprised of a 1.10 percent increase in intentional walks and a 0.38 percent increase in unintentional walks. So while the best get fewer unintentional walks in high leverage, everybody else gets a few more.
Here’s a graph showing, for top hitters, the difference between overall, intentional, and unintentional walk rates in high-leverage appearances for the past 20 years.
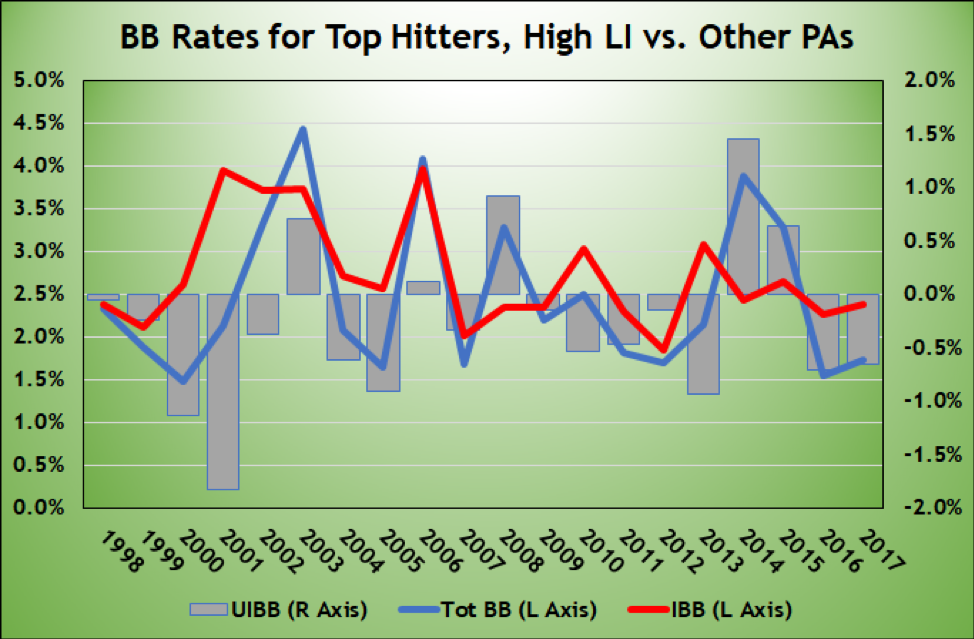
There’s a lot going on there, but the key feature for me is that those gray bars—the difference in unintentional walk rate in high-leverage plate appearances compared to other plate appearances—are negative in three-quarters of the seasons. In other words, while the best hitters consistently walk a lot more in high-leverage situations (blue line), that difference is due to them getting a lot more intentional walks (red line).
So maybe those meetings where pitchers are instructed “don’t let him beat you” are unnecessary. Because the decision is taken out of their hands. It’s the manager, waving four fingers at the home plate umpire, who’s making that call.
But I think there’s an even more important takeaway here. As noted, the best hitters typically walk less frequently in high-leverage situations than they do in other plate appearances if you strip out intentional walks. That flies in the face of those who claim some batters are “too passive” when the pressure’s on, that they should “expand the zone” by going for the key RBI instead of walking to first base. Like, say, this guy, who’s been one of the top 15 hitters in the majors in seven of the past nine seasons:
| Joey Votto | UIBB – High LI | UIBB – Other | Difference |
| 2009 | 8.9% | 11.5% | -2.6% |
| 2010 | 13.8% | 12.6% | +1.2% |
| 2011 | 13.9% | 13.0% | +0.9% |
| 2013 | 14.4% | 16.4% | -2.0% |
| 2015 | 16.4% | 18.9% | -2.5% |
| 2016 | 11.1% | 14.4% | -3.3% |
| 2017 | 18.5% | 15.6% | +2.9% |
| Total | 14.1% | 14.7% | -0.7% |
(Note: Differences do not add up due to rounding.)
Hey Reds fans (and announcers) frustrated that Joey Votto is not aggressive when the pressure’s on: You’re wrong. Despite batting in a lineup in which he’s sometimes the only legitimate threat, he takes a walk less frequently in high-leverage appearances, 14.1 percent of the time vs. 14.7 percent when the leverage isn’t high. He gets intentionally walked a ton—6.2 percent of plate appearances in high leverage, 1.2 percent otherwise—but he’s less patient and more aggressive when he’s not receiving an intentional pass in clutch at-bats.
And that’s true of his peers. All hitters walk more in high-leverage plate appearances. For the very best, though, that increase is more than 100 percent due to intentional walks. Elite hitters, when not being walked intentionally, walk less frequently when the pressure’s on. Everybody else walks more. The narrative about guys like Votto is entirely backwards. Which means either pitchers are ignoring the “don’t let him beat you” dictum, or the hims of the sport aren’t letting them follow it.
Extra thanks to Rob McQuown, who really went above and beyond pulling together the individual and overall data for this.
Thank you for reading
This is a free article. If you enjoyed it, consider subscribing to Baseball Prospectus. Subscriptions support ongoing public baseball research and analysis in an increasingly proprietary environment.
Subscribe now
I thing one of the various explanations here could be that, in High-LI situations, Good Hitters (when not intentionally walked) are more anxious or decided to swing at the ball and try to get it done by themselves because the know they're good (and maybe the best option in their teams), while less-good hitters (not to say, the really-bad ones) are expecting a saving fourth ball that takes them to first and just "let the next one do the hard job".
Thank you for the article.