My presentation at Saber Seminar this year was about a potential alternative to our public pitch classification system for baseball analysts. The following is a summary of my 10-minute presentation.
Background
Before discussing the potential for an improvement to our current public pitch classification system, let’s go over some background on how Statcast currently classifies pitches. MLB Advanced Media, a branch of the league responsible for Statcast data, uses classification algorithms to assign each pitch a “pitch type” (like Fastball, Curveball, Changeup, etc.) in real time, right after it is thrown. This type of classification is called “supervised” because the possible groups (Fastball, Curveball, Changeup) are predetermined. Each pitcher has his own algorithm (MLBAM uses an algorithm called a neural network) to classify his own pitches that exists independent of any other pitcher’s pitch classification algorithm.
As for which pitch types are used, MLBAM says, “Each pitch in each pitcher’s repertoire is classified as the pitcher himself calls it; for instance, a pitch that one pitcher calls a cutter may be called a slider by another, even if the velocity, spin and movement of both pitches are essentially identical.”
This means that if Pitcher A says that he only throws a Sinker and a Slider, his algorithm will assign each of his pitches as either a Sinker or a Slider.
All of this should generally make sense. MLBAM has simply automated the process of naming each pitch that a pitcher throws in every game all year. And the process works pretty well for their purposes. The MLBAM Vice President of Data Operations, Cory Schwartz, told me, “our primary concern in pitch classification is for event/play descriptions… that is, entertainment purposes first.” For general fan consumption, the current system works.
Issues for Public Analysts
This system, unfortunately, can cause a few major issues for public baseball analysts doing pitch-level analysis with this data. And because the Statcast data found at Baseball Savant is one of the most robust free, publicly available datasets for MLB data, it is the source of a majority of public analysis about pitches in the last few years.
There are two major issues an analyst may face when using the pitch classifications from MLBAM. The first is that, in MLBAM’s own words, “A pitch that one pitcher calls a cutter may be called a slider by another, even if the velocity, spin and movement of both pitches are essentially identical.”
Let’s see this in a more concrete example. This is Jacob deGrom’s “Slider”:
MLBAM calls this pitch a slider because that is what deGrom himself calls it. Now take a look at a very similar Lance Lynn “Cutter”:
These pitches have similar velocity, spin, and movement, but have different names. For the sake of consistency, and analysts’ collective sanity, these two pitches should probably have the same categorization.
The second issue a public analyst using MLBAM pitch classifications may face is that very different pitches often share the same categorization. This is because MLBAM uses seven main pitch types: Fastball, Sinker, Cutter, Changeup, Splitter, Curveball, and Slider. Only using these seven leaves lots of room for different pitches to have the same name because there are not enough groups. Again, let’s look at an example of this issue. This is Charlie Morton’s “Curveball”:
This pitch averages over a foot of horizontal movement. Now compare it to Morton’s teammate Tyler Glasnow’s “Curveball”:
With a much more vertical spin axis, Glasnow’s breaking ball has far less horizontal movement than Morton’s. Although these two pitches are somewhat similar, they are different enough that an analyst should probably differentiate between them. If an MLB hitter was preparing to face a curveball from a Rays starter, he would probably want to know whether he would be facing Morton’s “Curveball” or Glasnow’s. For this reason, these two pitches should belong to different pitch categories.
So, the two main issues with the current standard for public pitch classification system, that similar pitches can have different names and that significantly different pitches can have identical names, can create issues in pitch-level analysis. So how can we, as public analysts, combat these problems and more appropriately classify pitches?
The Model
For this project, I created an unsupervised machine learning model, allowing for similar pitches to be grouped together based on their flight characteristics regardless of their previous categorizations. Using an algorithm called a k-means classifier, I reclassified more than 6,000 random pitches from 2015-2018 MLB right handed pitchers based on each pitch’s velocity, spin rate, vertical movement, horizontal movement, spin axis, and spin efficiency.
The first problem, similar pitches having different names, was improved by my method of grouping pitches according to their flight
characteristics, not by what they are called. Identical pitches, like deGrom’s “Slider” and Lynn’s “Cutter” will now always be together in the same group.
The second problem, different pitches having identical names, was improved by increasing the number of pitch types from seven, making it more likely for different pitches to be in different groups. This machine learning method can be done with any number of groupings, so how many pitch categories should we have?
Note: Those familiar with this machine learning method are probably expecting that I use the Elbow Method to find the optimal number of groups for my data. However, this method suggests we have only four pitch groups. The goal of this model is to create more pitch groups, not fewer, so instead I ran a k-means classifier with seven groups, then eight, then nine, and on until there was overlap between the two means of the newly created pitch groupings on a typical movement plot. When this happened, that meant that I had created too many groups, as similar pitches were once again being given different names.
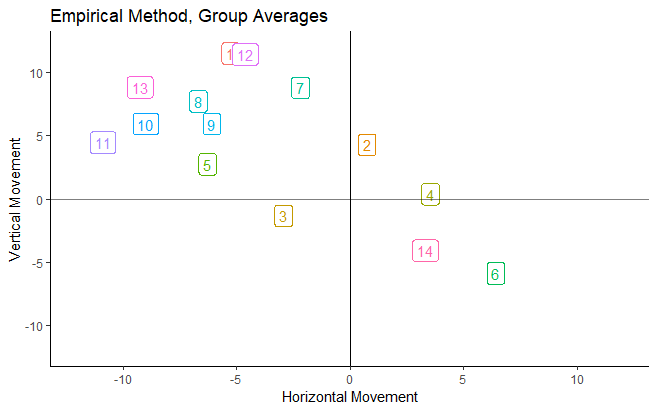
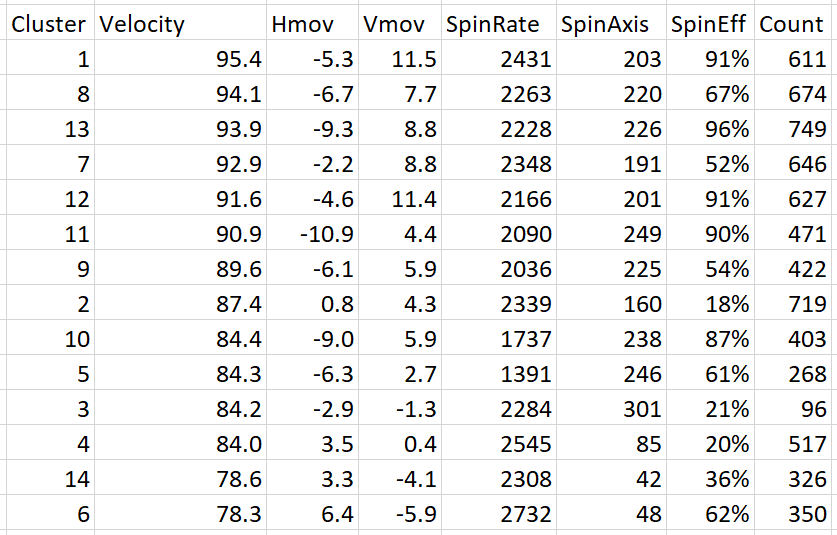
For my data, 14 pitch types was chosen as the best number of pitch groupings. This number would likely be a bit different if more or different data was used, so this should be seen as only loosely representative of the true best number of pitch types for all pitches. The difference between the two methods of pitch classification, MLBAM’s existing method and my empirical method, can be seen below.
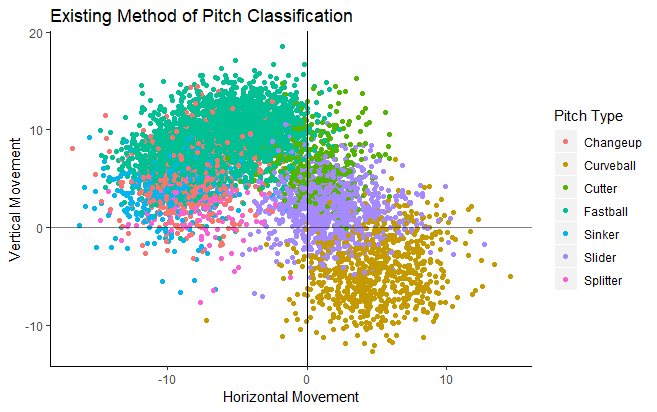
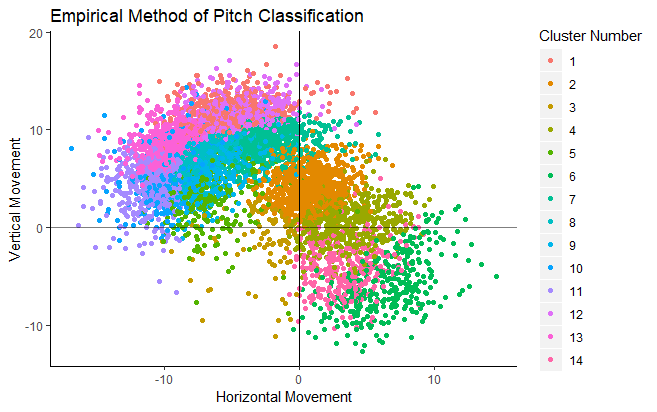
With more groups on the right, we see that pitches that were previously between two groups, like those “Slurves” between Sliders and Curveballs, now have their own group with this new method. The reduction of overlap between two pitch groups is indicative of more specific and distinct categorizations, which is an improvement for an analyst.
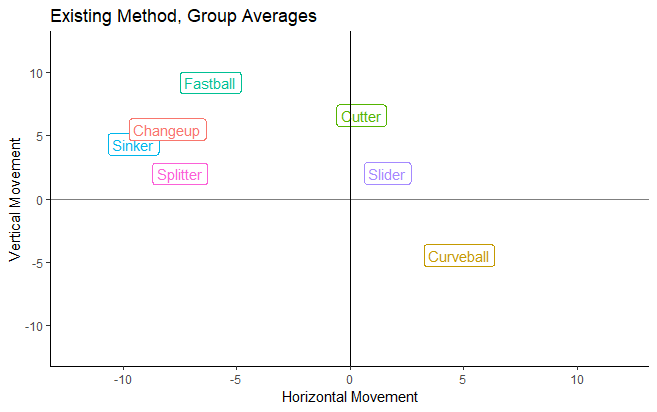
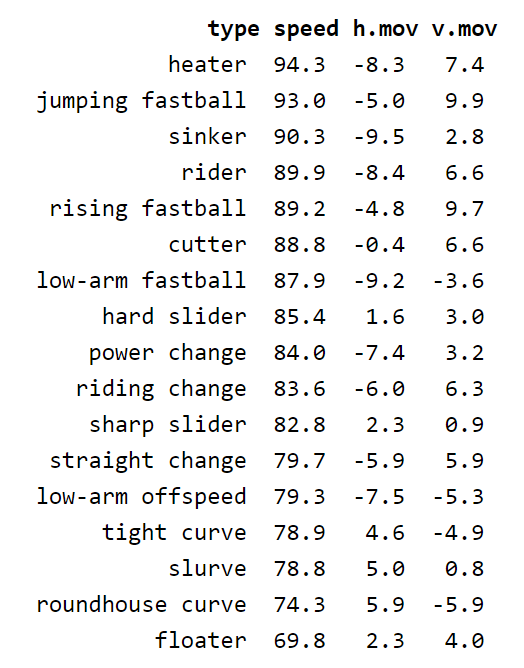
Taking a look at the group means is another way to show that adding more groups helped break up large classifications like “Slider” and “Curveball” into more distinct groupings.
Classifying pitches based on their flight characteristics and increasing the number of pitch groups improves upon the two major issues with the current public pitch classification system, allowing public analysts to be more precise in their pitch-level analysis. But the benefits of using this type of model extend to many other areas of baseball as well.
Additional Benefits of New Model
The first is advanced scouting. Say a report is being prepared for Cody Bellinger to face Justin Verlander in the 2019 World Series. They have only faced each other a handful of times in last year’s World Series, and Batter vs. Pitcher data is never very robust anyways. Instead, we could look at how Bellinger has fared against pitches like Verlander’s fastball, like those in the same pitch group as Verlander’s fastball. This information would allow coaches, players, and analysts to prepare for upcoming opponents more effectively than using public pitch classifications.
Another application is player development. Because a “Slider” is just whatever a pitcher calls his Slider (like deGrom’s, which profiles more like a Cutter), there is no universal, agreed upon definition of a Slider. This goes for most other current pitch types as well. Where there is a lack of uniformity, words can lose their meaning, allowing for miscommunication between coaches, players, and analysts when talking about pitches. In an MLB farm system, eliminating this inefficiency could be very valuable to the development of prospects and would come at little cost.
The last application of a more empirical pitch classification method that I will focus on here is in player evaluation and comparison. For example, this is the leaderboard of pitchers with the most strikeouts on Curveballs as of the 2019 All Star Break:
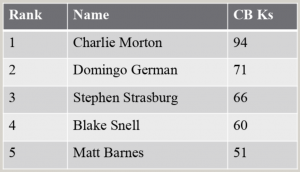
We see hundreds of leaderboards like this without batting an eye, but there is a chance that these pitchers are being compared unfairly, apples to oranges. To see if this is the case, I examined the data to see whether the Curveballs of the four righties on this list were in similar clusters:
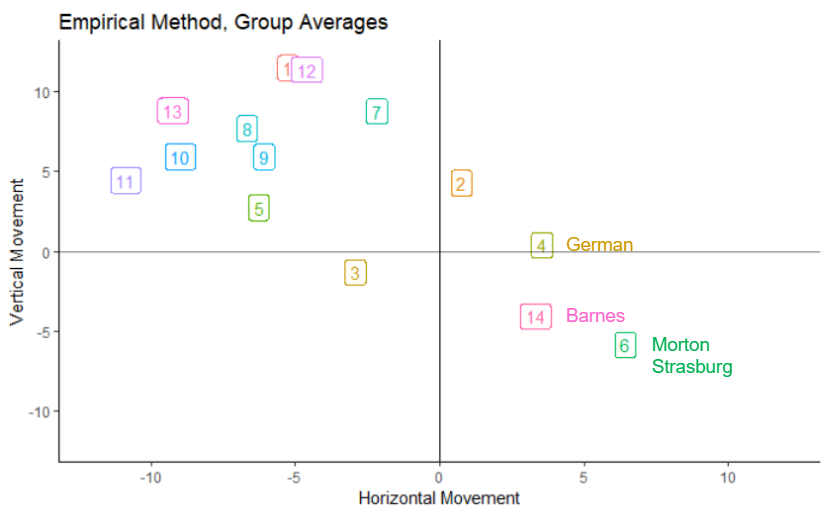
It turns out that they are not! The “Curveballs” on this list are all so different that it is misleading to compare their results. Instead, a list of pitchers with the most strikeouts on pitches in the same cluster would be a more informative, apples to apples comparison. Any discussion comparing a pitcher’s pitches to another’s would be better off by making sure the pitches being compared are actually similar in profile, not just in name.
Previous Research
The concept of classifying pitches by their characteristics is not new in public baseball analysis. Driveline Baseball used this concept in a recent article, but the lion’s share of the public work on this topic was done by Max Marchi in two Hardball Times articles in 2010. Although I was not aware of his methods before doing my analysis and the articles do not specifically mention which type of clustering algorithm he used, the results of his classifications indicate he also used an unsupervised method. For comparison, here are the pitch type groups that his analysis found versus the groups from my analysis:
Marchi’s Groupings:
Moore’s Groupings:
Interestingly, Marchi also found that 14 pitch types worked best for his analysis initially before eventually settling on 17 different pitch types. Despite our two models being trained on a completely different set of data (his was presumably using pitches from 2010 measured by PITCHf/X, mine used pitches from 2015-2018 measured by TrackMan) and mine using a few more variables related to spin characteristics, the results are fairly similar.
My goal with this project is to show how an unsupervised approach to pitch classification could be more beneficial to public analysts doing pitch-level analysis than using MLBAM’s current system. However, my model is just an example of how this could be done. Marchi’s model is a much more detailed and fine-tuned model that could certainly be applied to modern pitch data to group similar pitches together by their flight characteristics like he did in 2010 and I have done here.
Conclusion
MLBAM’s current method of pitch classification is engineered more for the common fan than for the public analyst, creating problems that can undermine pitch-level research. Instead, by grouping pitches by their characteristics and being more specific about the characteristics of pitches, the public analyst can be more precise with their research, all while observing benefits in advanced scouting, player development, player evaluation and comparison, and potentially many more applications of pitch-level analysis.
Thank you for reading
This is a free article. If you enjoyed it, consider subscribing to Baseball Prospectus. Subscriptions support ongoing public baseball research and analysis in an increasingly proprietary environment.
Subscribe now