
This article was originally published on Nov. 5.
For roughly 15 years, Major League Baseball has been supplying pitch tracking data to the public, through Gameday and in data formats available to curious and eager researchers. At each phase of development—we are now in Phase Three—this has enabled breakthroughs in our understanding of pitching and, in some cases, physics. The most recent update implemented for the 2020 season, Hawkeye, has provided yet another opportunity to improve our knowledge in both spaces. And we’re excited to begin sharing our discoveries and questions.
The biggest thing we’ve learned about pitching in the past few years is that Magnus force is not the only, or even primary, determinant of a pitch’s movement. Evidence and suspicion of this has been emerging for a few years, but the Hawkeye system has shown what some pitchers and scientists have been trying to tell us—especially about sinking fastballs. The concept of seam-shifted wake (SSW) opens the door for application of non-Magnus force driven models to further our understanding of the physics of pitching. The ways we evaluate, understand, and design pitches are undergoing yet another revolution.
How it Started
At the end of 2006 season, a company then known as Sportvision installed cameras that could track pitches, giving us speed, movement, and location. The system made its debut during the playoffs and continued a broader rollout through 2007. By 2008, every major league park had the system in place, and the PITCHf/x era was underway. Over time we’ve grown accustomed to instant display of a pitch’s speed, where it crossed the plate, and even what type of pitch it was.
At the outset it was a revelation, as broadcasters, beat writers, analysts, and (amazingly!) even physicists roamed freely in the new pastures. And we learned a lot. For example, we learned that the ball slows down on its march towards home plate, losing some 8-10 percent of its release speed due to air drag. We also learned that for any pitch, the ball doesn’t travel on a straight-line path. It deviates from that path due to forces acting on the ball. We all knew and understood one of those forces, gravity, which always pulls the ball downward. But we only had a vague idea about another force, the so-called Magnus force on a spinning baseball, and how it acts to deflect the ball. Unlike gravity which always acts to pull the ball down, the direction of the movement due to the Magnus force is a bit more complicated. A simple way to think about it is that it is the direction that the front of the ball—the side seen by the batter—is turning due to the spin. For example, an over-the-top fastball has pure backspin, so the front of the ball is moving up and the resulting movement is in the upward direction. A “12-6” curveball has pure topspin and the movement is downward.
While a sidearmer puts pure sidespin on the ball, resulting in arm-side movement. As shown recently by the Tampa Bay Rays’ bullpen, there is a full spectrum of possibilities.
PITCHf/x did a great job telling us the speed of a pitch and how much it moved. But it wasn’t giving us all the information we wanted, particularly how the ball was spinning. PITCHf/x inferred the spin rate from the total (non-gravity) movement and the spin axis from the direction of the movement. There was no direct measurement of the spin rate—it was calculated using relationships between spin and movement measured in laboratory experiments, ignoring something very important that we didn’t fully understand then (but understand much better now): Gyrospin reduces the spin efficiency and greatly complicates determining the spin rate from the movement. All spin is not alike!
No big deal, this was still a wealth of new information. It felt like the biggest thing we were missing was how fast sliders were spinning, but, naturally, we didn’t know what we didn’t know.
Starting in 2015, MLB moved from Sportvision’s pitch tracking technology to Trackman’s radar based system, as part of the move to a full field tracking system we all know now as Statcast. Trackman gave us something new—a more directly measured spin rate. Now we could see how hard sliders were spinning and just how slow some splitters rotated on their way to the plate.
This clearer understanding of spin rate helped us understand pitching more than the inferred method did, but the spin axis was still inferred, in exactly the way it was done by PITCHf/x. The conventional wisdom was that effectively all measurable pitch movement came from the combined effects of gravity and Magnus forces. Meanwhile, researchers were probing the limits of this model using other emerging technologies that would revolutionize the field in some unexpected ways.
| System | Provider | Technology | In Use | Spin Rate | Spin Axis |
| PITCHf/x | Sportvision | optical | 2006-2014 | inferred | inferred |
| Statcast | Trackman* | radar | 2015-2019 | observed | inferred |
| Statcast | Hawkeye | optical | 2020- | observed | observed |
*ChyronHego also provided optical tracking of players and the ball, but this was not fully integrated into the Statcast system outputs made available to the public
The Players Always Know First
To our knowledge, the first prominent baseball player to note the effect of seams on a pitch trajectory was Trevor Bauer. As he described in an email to Barton Smith:
I began thinking of ways to orient the ball around the axis in 2010. I used to throw two types of sliders in college, one was noticeably flatter and ran more to the glove side, the other ran less and had more depth … As pitch tracking wasn’t a thing back then, we agreed that there was a discernible difference in the movement of the two pitches and moved on from there. In 2014 or 2015 … Kyle Boddy and I began discussing laminar flow two seams … I spent all off-season developing [a pitch] and getting the axis and orientation correct, and I noticed a massive swinging effect in my first outing of the following year against Houston. I struck out 11 in six innings, many on the pitch we lovingly called the laminar express … I wasn’t sure the physics were perfectly correct though, as there were some inconsistencies with the observed movement and my understanding of the physics at the time, but the observed movement was what I was after and I moved on from there.
One subtle but very important aspect of Bauer’s claim was that the flight of the ball was dependent on the orientation of the seams relative to the spin axis. The “Magnus-only” point of view says that only the axis matters. The video below illustrates how two pitches with the same axis (spin direction and efficiency) and have different orientations.
Barton Smith had a different take on how a “Laminar Express” works, but realized that these pitches have movement that is not explained by Magnus Effect and require the orientation of the ball that Bauer described. In 2019, Smith and his team at Utah State University began studying these effects in the lab. The measurements were conducted on a ball pitched by a specialized cannon that spun them about a vertical axis. In a Magnus-only world, such a pitch should have only horizontal movement but no vertical movement. Nevertheless, they found that either positive or negative vertical movement could be induced by changing the orientation of the seams of the ball relative to its spin axis. These experiments provide very strong evidence that an additional force is causing movement–a force that is related to the orientation of the seams. The phenomenon was dubbed Seam-Shifted Wake (SSW). Driveline discussed Seam-Shifted Wake in a November 1 post.
The SSW pitches were discovered in laboratory experiments, thus the question arises: Is there any evidence that such pitches are thrown in major-league games? The story of Jared Hughes serves as connective tissue to help us answer that question:
In April of 2020, Smith met Jared Hughes, a 9-year MLB vetran relief pitcher who was a free agent at the time. Hughes recalls,
A few years back I was having inconsistencies in achieving my best sinker. I noticed that when it moved less downwards, I had less success. I went to a coach for help and he mentioned to me that my success in finding weak contact was better when my sinker was past 270°. Typically when the axis entered that range I had more vertical movement (pfx_z). We looked at some slow motion video and watched my best sinker (280°) vs. my worst sinker (260°). It was hard to see any spin differences. We didn’t know we were looking at inferred axis.
In the 2019-2020 offseason I decided I would work on it. While throwing in the fall and winter, I noticed that 280° was actually top spin. So I worked on earlier pronation and slightly lowering my arm slot. I went into my first spring training with those in mind. My axis didn’t really change much. Once the season was postponed and I had some data from the first 2020 spring training, I was still perplexed as to why my sinker wasn’t consistently past 270.
In comes Barton Smith. My old friend who is now a professional pitching coach, Demetre Kokoris, encouraged me to join a Zoom call with him. In that call Barton explained how seams can influence movement. Towards the end he opened up a Q and A and I asked about pitchFX data. He explained to me that it was possible for Trackman to misread axis if the thrown ball had other factors influencing movement.
I bought a Rapsodo, a high tech slow motion camera, and started uploading videos to Barton. The Rapsodo confirmed that I was closer to 250° and the slow motion video gave Barton a look into how the seams of my sinker interacted with the air. He gave me tips on how to align the seams for better movement.
Barton helped me immensely. I learned that my best movement has to do a lot with grip. I have notes on which grips work best for me. My grip can change in-flight seam orientation and gyro. Those two things in unison can create upward or downward seam shifted wake on my fastball. My spin axis is actually pretty consistent.
My sinker was much better at times this season, but at other times I couldn’t find it. [Hawkeye] was able to give me the optical axis along with pitch movement after every outing. It also has the 3D axis that includes gyro. I learned a lot. The Mets pitching crew Jeremy Hefner, Jeremy Accardo, Ricky Bones, Jared Faust, and David Lang were right there on the pitch movement frontier with me. I now have some really interesting insight on how my pitches move the best and also what made them have the most in-game success.
I think throwing to both the Rapsodo’s optical axis and Trackman’s inferred axis at the same time is an ideal way to practice. Rapsodo will understand exactly how the ball is leaving your hand. Trackman will tell you exactly how the pitch is moving.
Hughes is able to manipulate the orientation and gyro degree of his sinker, and through these tests, a picture of the best orientation for SSW effect sinkers began to emerge. Perhaps most surprisingly, Smith’s analysis of Hughes’ four-Seam fastball revealed that it had an unexpected upward force. Hughes eventually signed with the Mets in 2020 making his data, as measured by Hawkeye, available.
Which brings us to the most recent season, 2020, where Statcast moved from Trackman’s pitch tracking radar units to Hawkeye’s multiple camera arrays. Now a dedicated camera is measuring spin, and directly observing the tilt of the axis–inference is no longer required, and we can begin to really delve into pitch movement in a way we haven’t been able to before. We’re already learning a lot, as we are about to show.
Exploring the 2020 Hawkeye Dataset
We looked at every pitch thrown during the 2020 regular season (over 263,000) and compared the two quantities that we’ll call the inferred axis (IA) and the observed axis (OA). As before, the inferred axis is found from the pitch movement, using the technique discussed by Nathan, under the assumption that all the movement (with gravity removed) is due to the Magnus force. The observed axis is measured directly by the Hawkeye cameras. Any deviation of the IA from the OA is direct evidence for movement unaccounted for by the Magnus-only assumption. For convenience, we’ll define the Axis Shift as OA-IA.
What does this look like league wide? Changeups, fastballs and sinkers are shown in Figure 1. Changeups and sinkers are generally shifted to above the line for RHP and below for LHP. It’s quite clear that an Axis Shift is the norm for all three pitches. For fastballs, the direction of shift is reversed. It is also very clear that this is common. One simple way to interpret the Axis Shift we are seeing is that the data show more arm-side movement for sinkers and changeups and less arm-side movement for fastballs than one would expect based on the OA. Although it cannot be proved just yet, this behavior is consistent with expectations from SSW, and the data show clear-cut evidence for non-Magnus forces acting on the baseball.
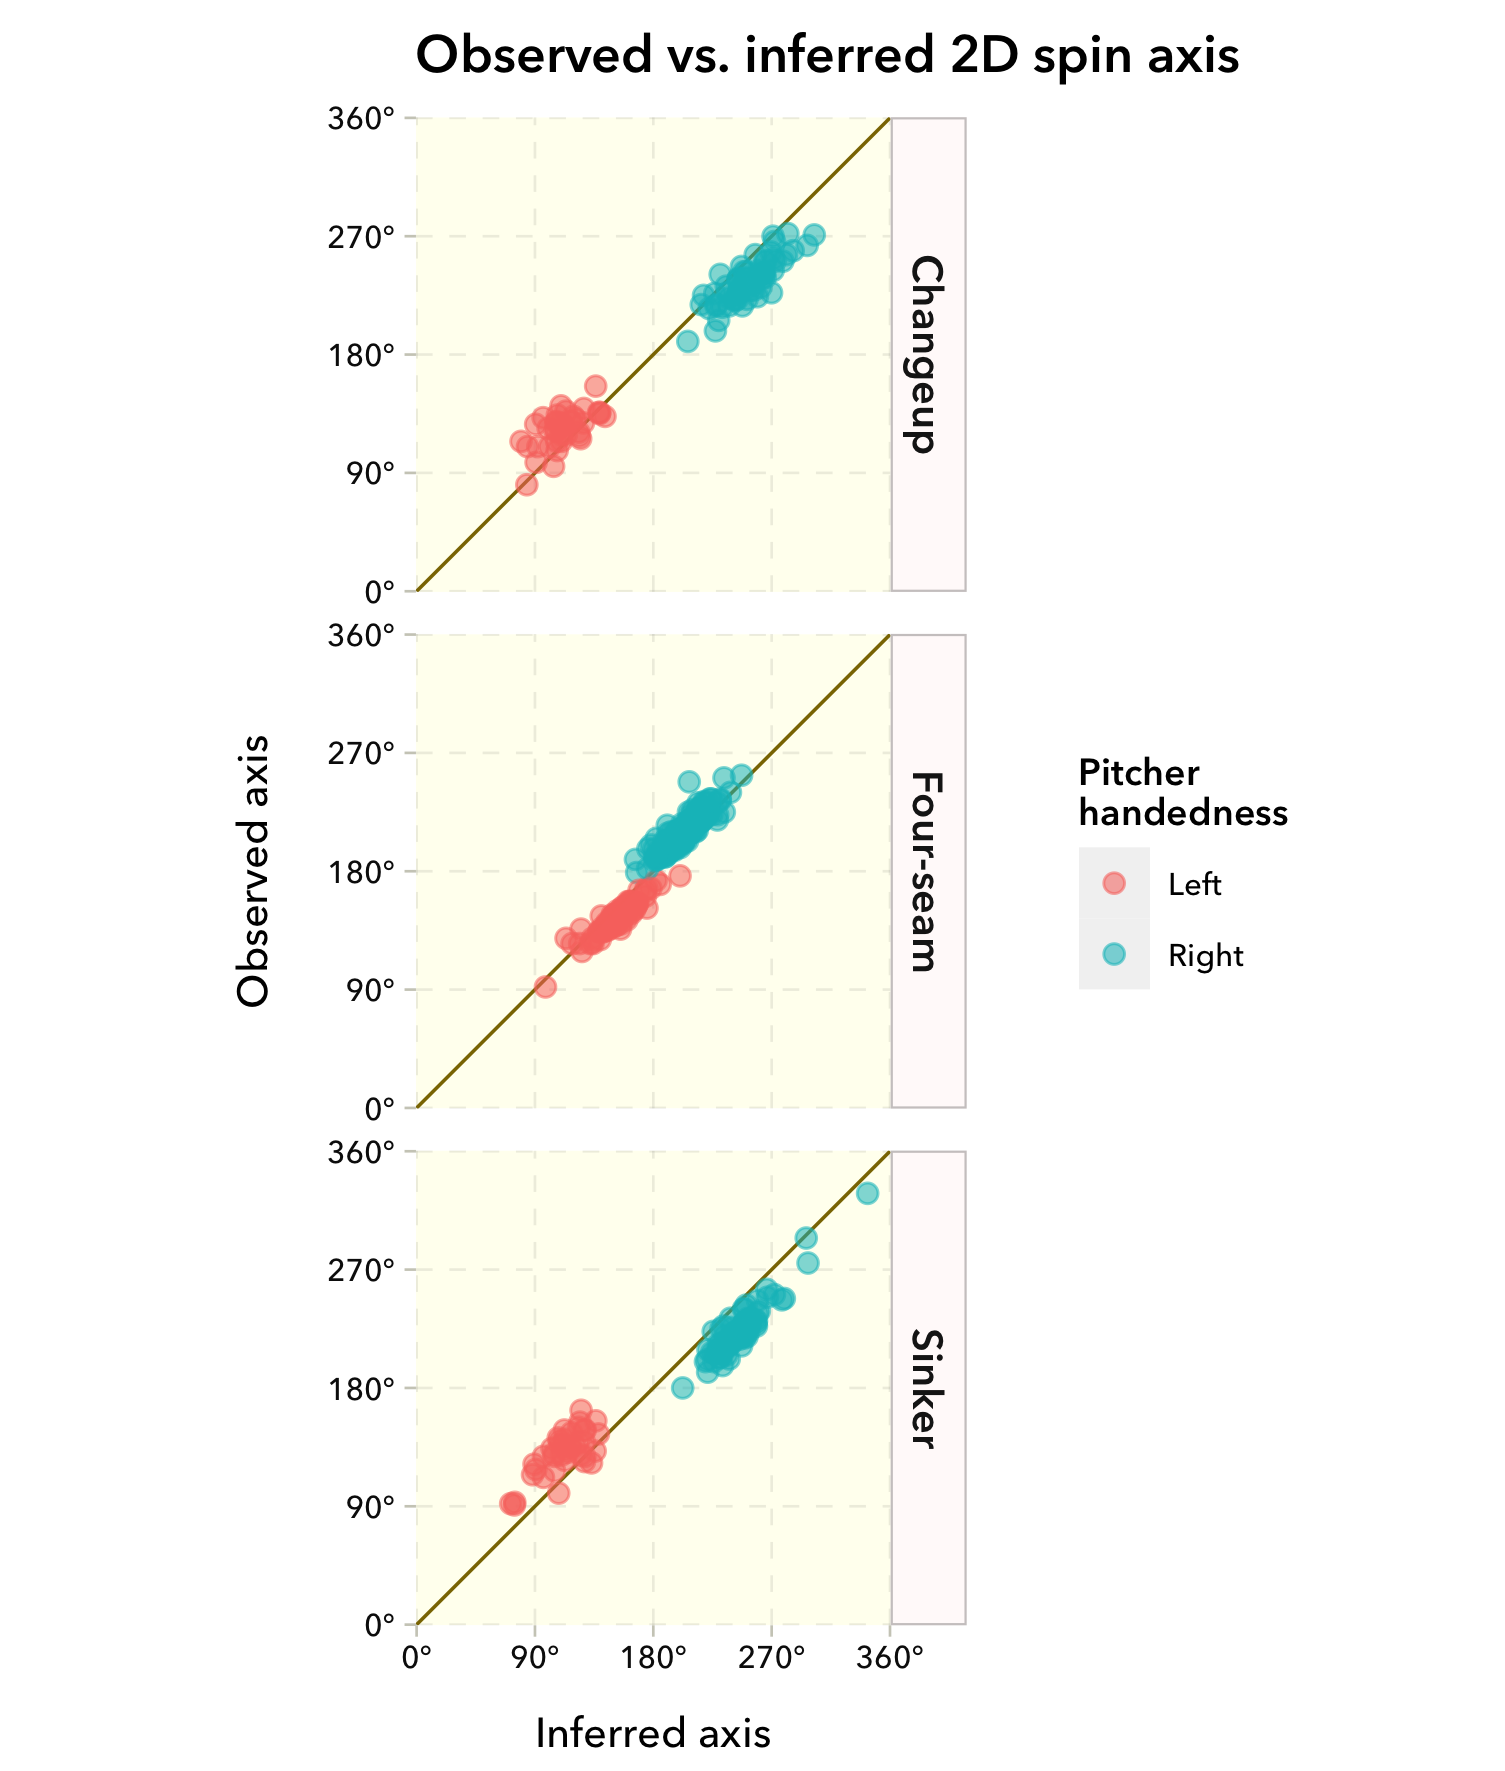
Figure 1. OA vs IA for all major league pitchers who threw at least 100 changups, fastballs, or sinkers.
Figure 2 shows the data for the same pitches plotted to show the correlation of a pitch’s total movement with shift in the axis. In general, we find that large shifts in axis are often correlated to less movement, especially for fastballs. Since Smith claims more gyro gives more SSW effect (to a point), it is plausible that 1) more axis shift requires more gyro and 2) The SSW effect on two-seam sinkers can mitigate the Magnus force lost with gyro while the four-seam cannot. This is evident in the flat region of movement vs axis shift in the sinker plot from -20º to 20º.
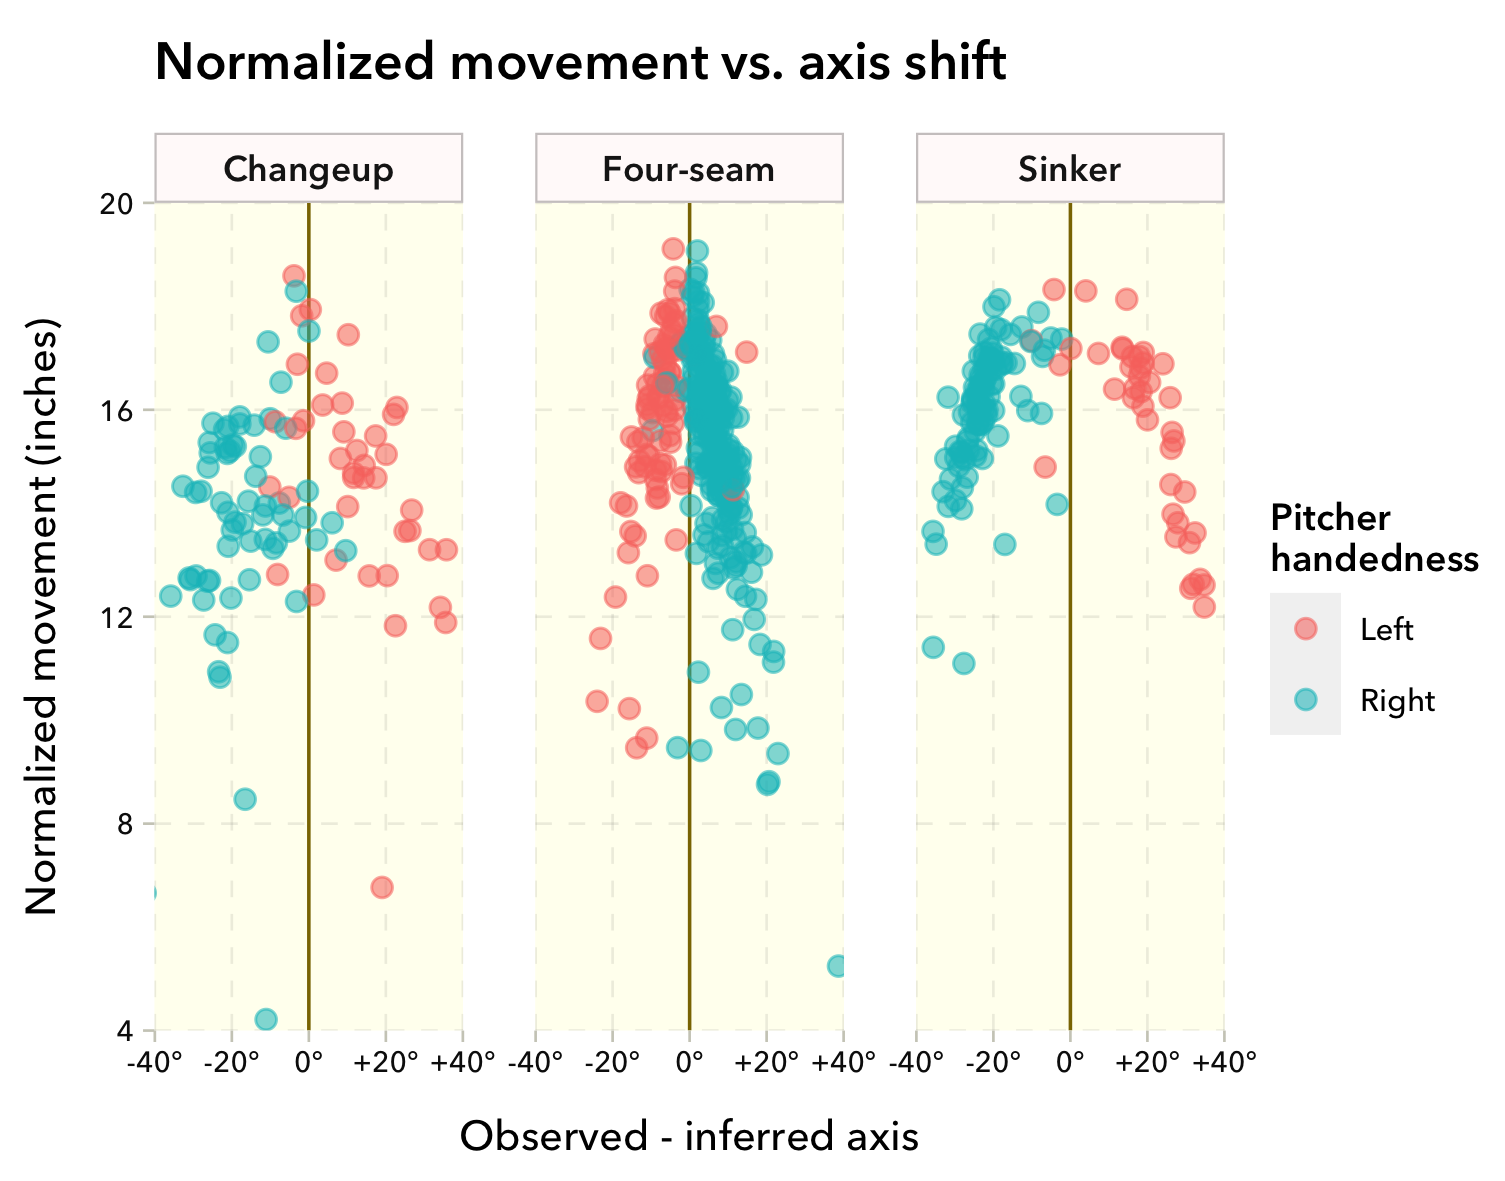
Figure 2. Movement vs Axis Shift for all major league pitchers who threw at least 100 changups, fastballs, or sinkers. The movement has been normalized to a fixed air density and is measured from 50 ft to the front edge of home plate.
How does this look for an individual pitcher? In some cases, the two measurements agree well, indicating that the Magnus model works. Perhaps the best example we have seen is Gerrit Cole’s four-seam fastball (FA). In each of the following plots, the OA is on the vertical axis and the IA is on the horizontal. If a pitched lies on the diagonal line, the two measurements agree. On average, Cole’s four-seamers (Figure 3) are right on the line and average an axis of 218º. Most four-seam fastballs (although not all, as shown above) behave this way.

Figure 3. Gerrit Cole’s 4-seam fastball.
By contrast, consider Kyle Hendricks’ sinker, shown in Figure 4. While the average OA of this pitch is 202º, the average IA is 35º larger, at 237º. This is nearly the largest sinker “axis shift” in the majors for 2020 of pitchers who threw more than 50 sinkers. We note that this data set contains a few OA misreads, but these do not substantially change the results.
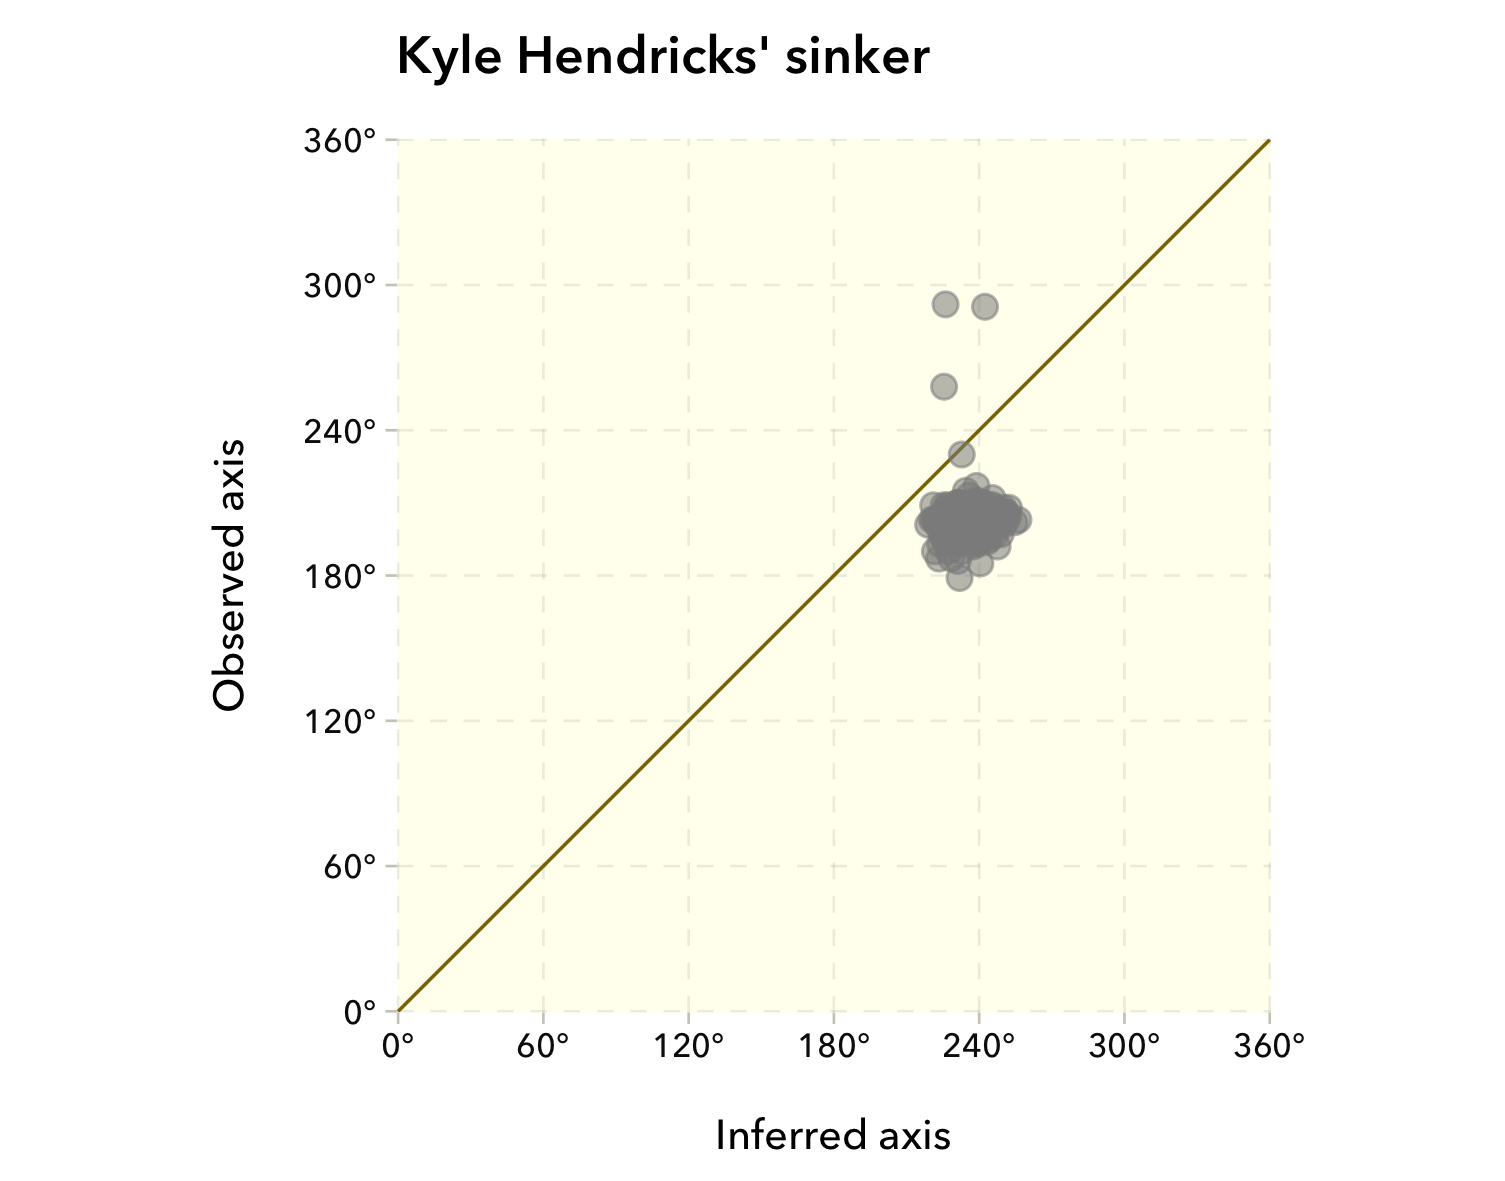
Figure 4. Kyle Hendricks’ Sinker.
In 2020 25 pitchers had more than 30º of shift on their sinker. Over 90 percent of all pitchers that threw 50 sinkers had at least 10º. For other pitch types a smaller percentage of pitches meet this threshold (only 29 percent of four-seamers).
Like many pitchers that throw sinkers, Hendricks also throws a four-seam fastball. That this pitch has a nearly identical OA to his sinker and also spins at a similar rate. In spite of this the two pitches move radically differently, as shown in the table below. While Magnus force keeps a four-seamer from dropping as much as gravity would typically dictate, and imparts a small amount of arm-side break, the sinker resists gravity less and swaps that resistance sideways, with the majority becoming arm-side break. The net deviation from a neutral, gravity- and drag-driven course, for both pitches is similar.
Hendricks uses SSW to convert vertical “rise” to horizontal “tail”. A likely explanation for this is that, as shown by Smith and his lab, SSW is more possible for a pitch with a gyro component. Gyro spin does not induce movement from the Magnus effect, so adding gyro decreases Magnus movement. In the case of the Hendricks sinker, the lost Magnus movement equals the gained SSW movement.
| Observed Axis (º) | Inferred Axis (º) | Spin rate (rpm) | Horz. Move. (in.) | Vert. Move. | Net Move. | |
| 4 seam | 205 | 204 | 1979 | -5.38 | -18.2 | 19.0 |
| Sinker | 202 | 237 | 1853 | -11.4 | -23.2 | 25.8 |
This is common, but it is even more common to see sinkers that move less overall (but in a different direction) compared to four-seamers as a result of SSW. This would indicate that the movement from SSW is smaller than the movement lost to inefficient spin. More rare are pitchers that can add more movement to their sinker with SSW than was lost to gyro. One example that will surprise no one is Dustin May whose sinker is shown in Figure 5. This pitch has much less axis shift than Hendricks’ sinker, as evidenced by the pitches closer to the line.
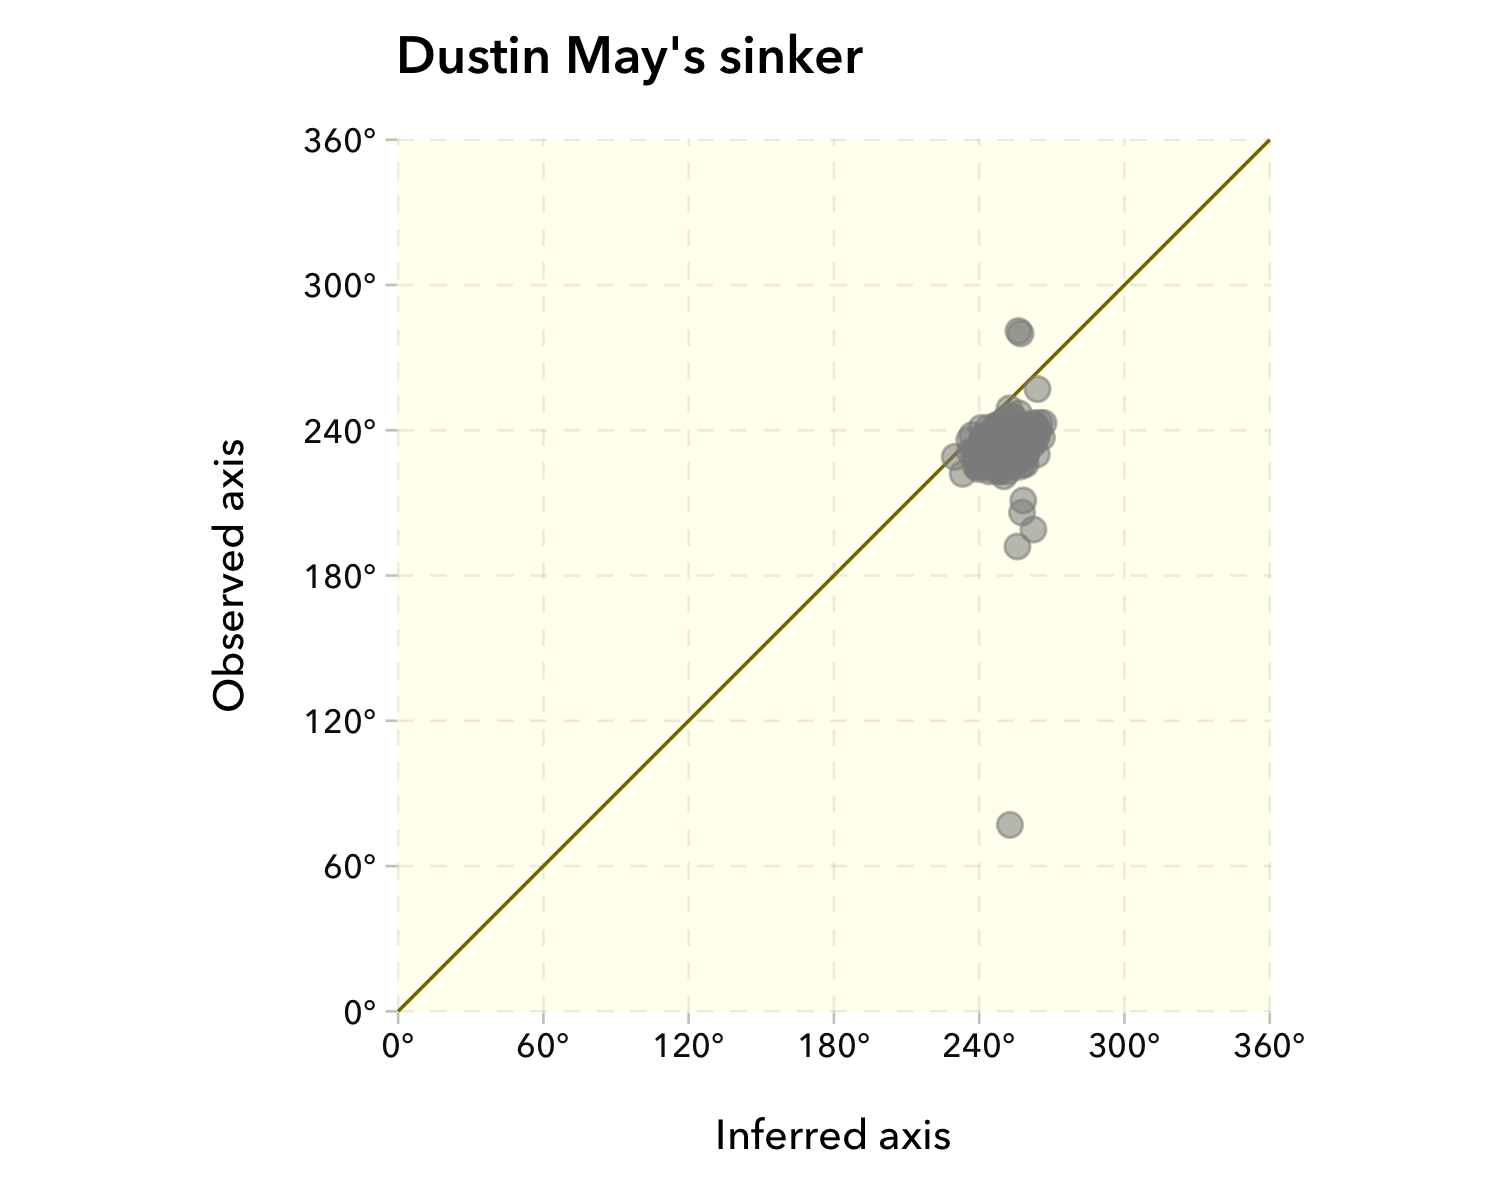
Figure 5. Dustin May’s sinker
What sets May apart is movement, as shown in the table below. His SSW sinker has a much smaller axis shift (about 15º) but has 10 inches more total movement than his four-seamer.
| Observed Axis (º) | Inferred Axis (º) | Spin rate (rpm) | Horz. Move. (in.) | Vert. Move. | Net Move. | |
| 4 seam | 225 | 220 | 2352 | -10.1 | -11.9 | 15.6 |
| Sinker | 233 | 251 | 2410 | -17.2 | -18.8 | 25.4 |
Jared Hughes has the ability to use SSW to cause his sinker to add movement in one direction while also causing his four-seam to gain movement in the opposite direction. Hughes’ sinker and four-seam fastballs are shown in Figure 6.
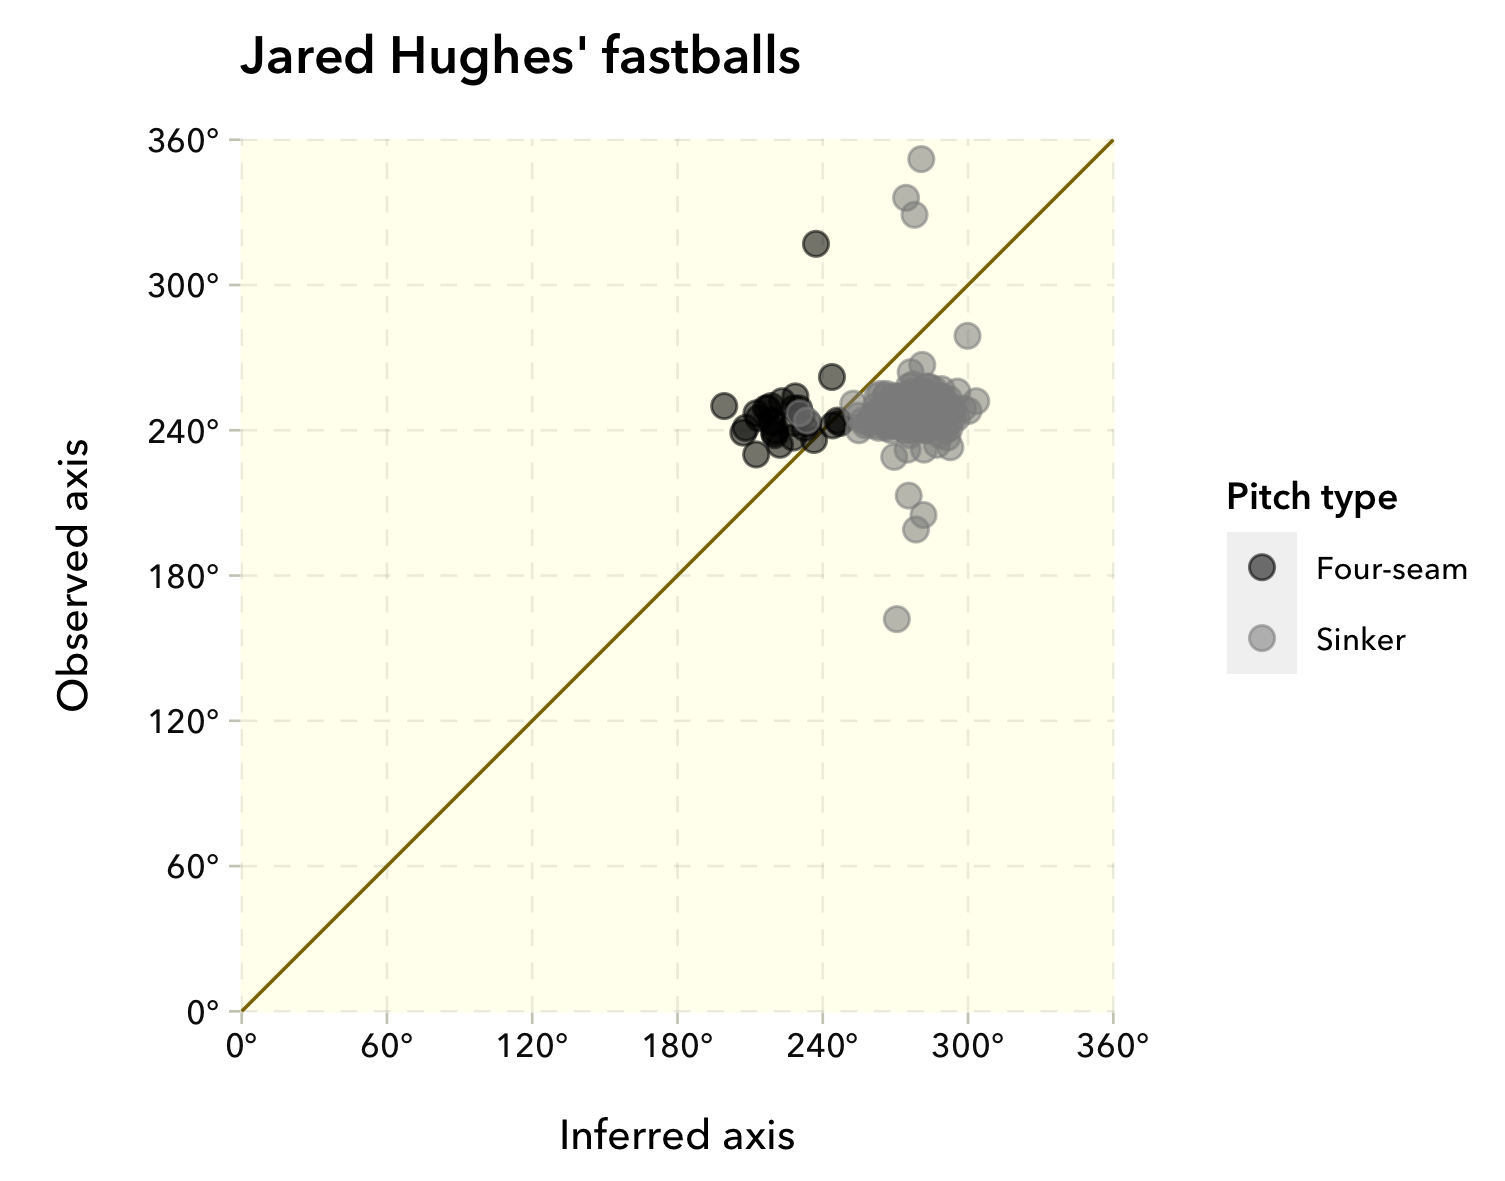
Figure 6. Jared Hughes sinker (grey) and 4-seam (black).
The most extreme example of this is Boston rookie Tanner Houck. While his sinker has a similar axis shift to Hughes, his four-seam moves even more glove-side. Framber Valdez of the Houston Astros is similar, but note that since Valdez is a left-handed pitcher, the sinkers and four-seamers are on the opposite sides of the line compared to a righty.
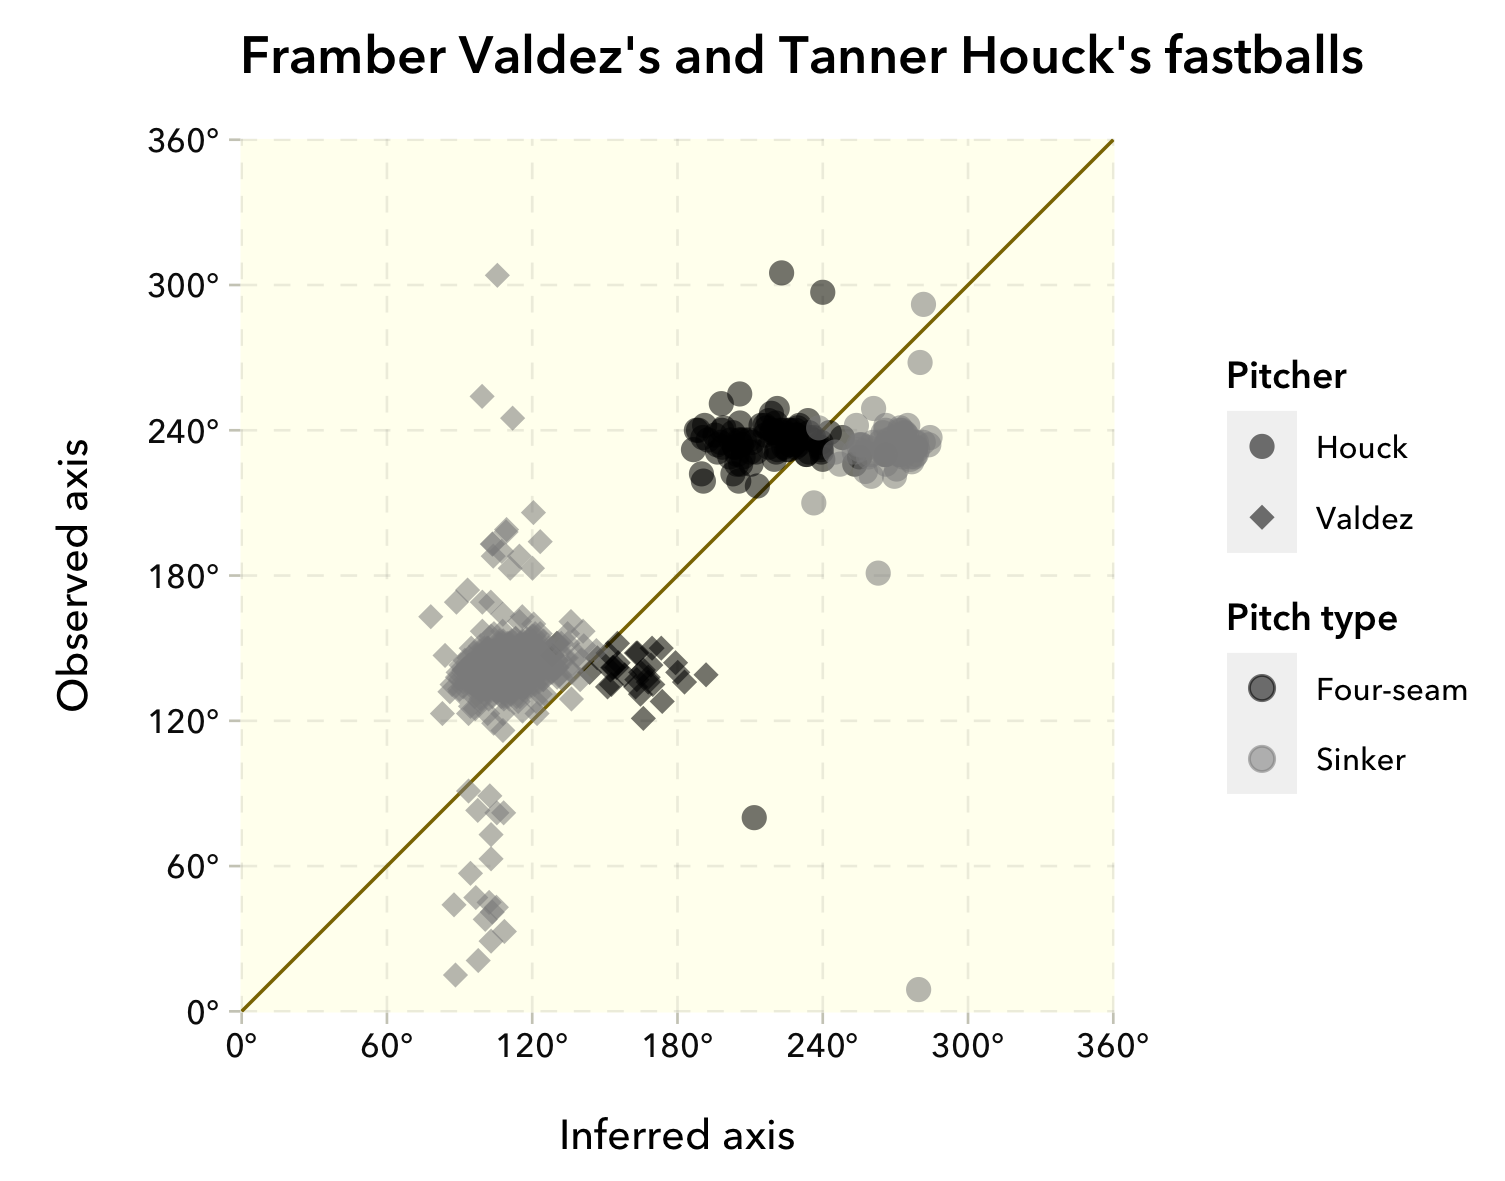
Figure 7. Sinker and 4-seamer of (a) Tanner Houck and (b) Framber Valdez.
A third pitch that often generates SSW is the changeup. The largest axis shift for a changeup in the majors this year was Zack Greinke’s. It’s also the weirdest changeup out there mostly because it exceeds the speed of his fastball. Greinke generates 37º of axis shift on his speedy changeup as shown in Figure 8. This is exceptional, but about 68 percent of big-league changeups have an axis shift of more than 10º.
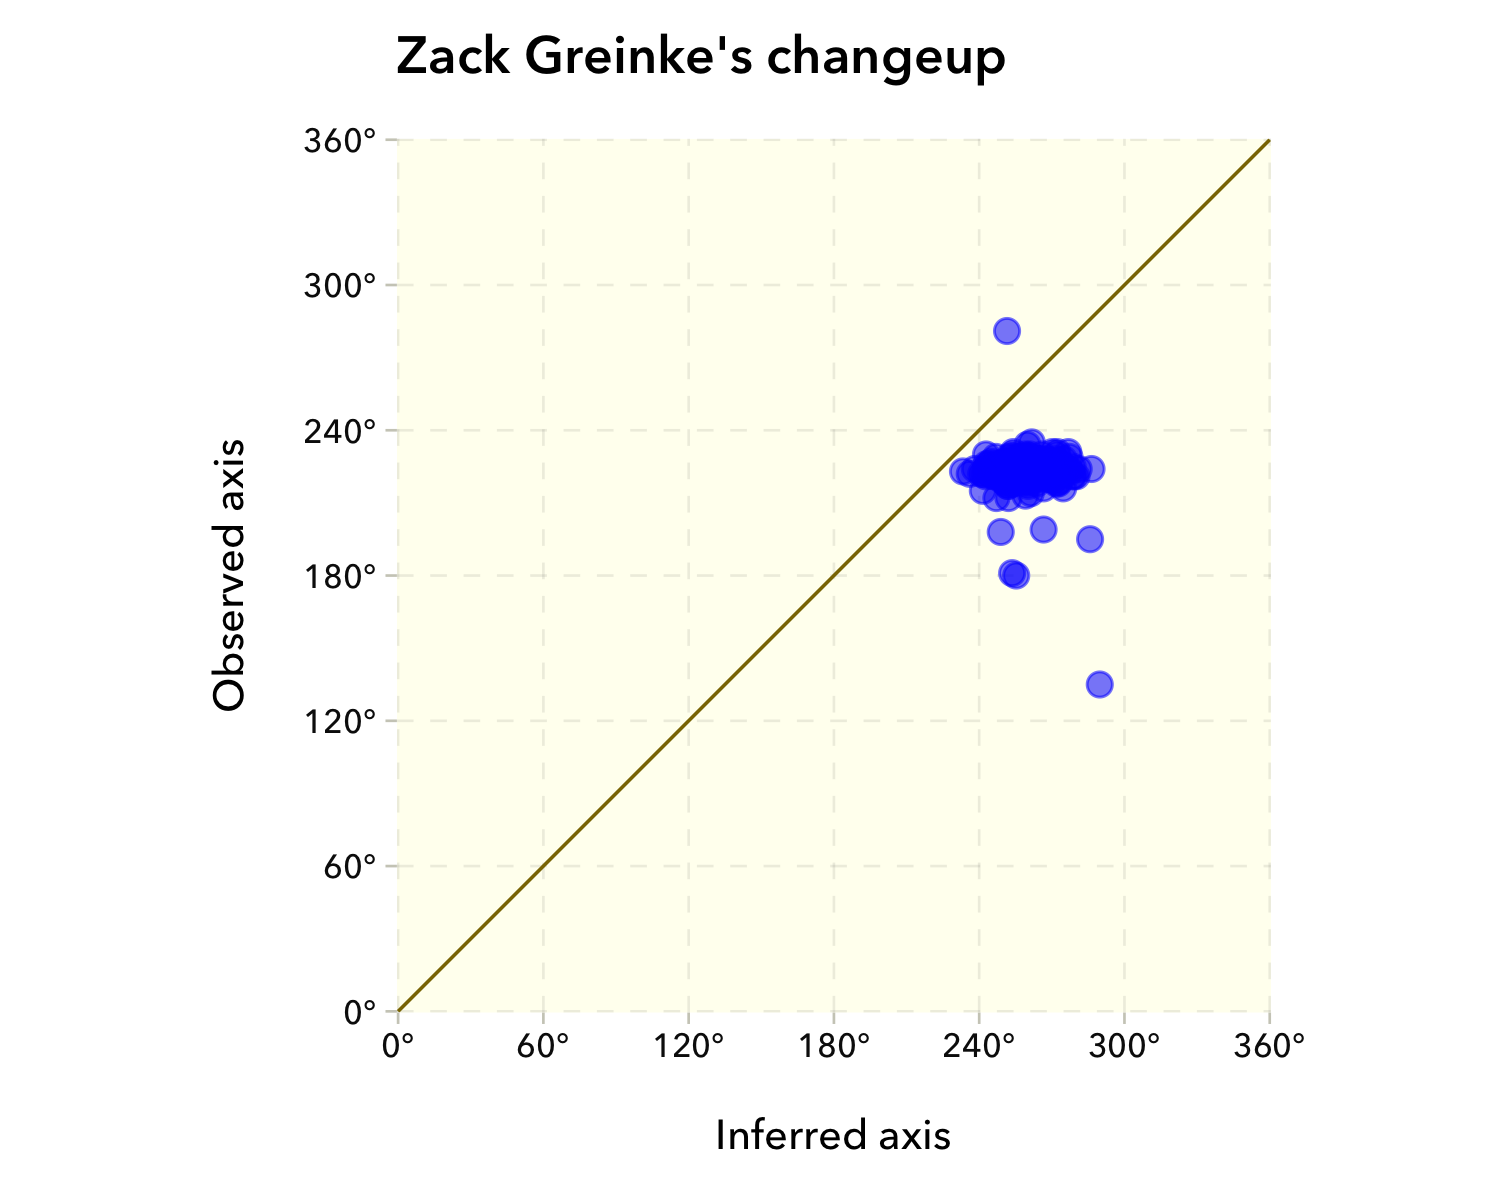
Figure 8. Zack Greinke changeup.
An additional feature of this changeup is the wide distribution of inferred angles (as evidenced by the oval shape of the data points in Figure 8). This suggests that while every changeup he threw in 2020 had SSW, some were much stronger than others. While his average axis shift was 37º, the most extreme pitch was over 62º! Looking back at Figures 6 and 7, this is a feature often present for sinkers as well.
So, what have we learned and what is the outlook for future analysis?
First and foremost, the Axis Shift gives us direct evidence that the Magnus force is not the only game in town when it comes to pitch movement. For sure, there is much more analysis to be done investigating individual pitchers and we look forward to doing that.
Second, the Axis Shift for fastballs and sinkers is qualitatively consistent with what the laboratory experiments have demonstrated for SSW. Additional data should help nail this down conclusively.
All of the analysis presented here uses the Hawkeye spin axis in two dimensions (i.e., in the x-z plane). But Hawkeye actually measures the spin axis in three dimensions, although those data are not yet publicly available. It is very interesting to speculate how knowledge of the full 3D spin axis might shed some light on the non-Magnus movement and its possible relationship to SSW. In particular, knowledge of the 3D axis allows a determination of the amount of gyrospin and therefore the spin efficiency. The laboratory experiments demonstrate how the Axis Shift is enhanced with gyrospin. It is quite possible we are already seeing some indirect evidence for that in Figure 2, which shows a reduction of movement correlated with an increase in Axis Shift. The full 3D spin axis would be needed to determine whether the reduced movement is due to a reduction in spin efficiency. It would also be of enormous value in determining quantitatively the magnitude of movement due to SSW as compared to the Magnus movement.
Another future opportunity is the seam orientation, data that Hawkeye can determine but, to our knowledge, are not yet provided to MLB. Since the SSW depends strongly on the orientation of the seams, direct observation of those seams would be of great value to pitchers, analysts, and physicists alike.
In conclusion, we have already learned a lot but have only scratched the surface. We can expect exciting times ahead, just as in the early days of PITCHf/x. Bring it on!
Technical and research assistance from Cory Frontin and Sean O’Rourke.
Graphic assistance from Gerald Schifman.
Pitch classifications by PitchInfo.
Thank you for reading
This is a free article. If you enjoyed it, consider subscribing to Baseball Prospectus. Subscriptions support ongoing public baseball research and analysis in an increasingly proprietary environment.
Subscribe now