Correlation and causation, forever intertwined in a statistical embrace, destined to be confused for each other in perpetuity. Such has been their fate with the mythical Times Through the Order Penalty (TTOP). Correlation proved that seeing a pitcher for a second or third time made it easier for the hitter. Familiarity was given all the blame; exertion levels were largely ignored. It’s time to ask a hard question about the TTOP in order to illuminate a compelling alternative.
The concept of a TTOP dates back to Tom Tango in The Book. At the time The Book was written, there was no clear way to quantify pitcher exertion levels. Mitchel Lichtman laid this theory out in great detail in his 2013 exposé of the notion, pointing out that, “Essentially, the more times a batter faces a pitcher during a game, the better he does at the plate.”
The cracks in the armor began to show in 2016, when Russell Carleton expressed his doubts about the TTOP, with some rather #gorymath. Rob Arthur followed that up recently, arguing that times through the order is mostly fatigue. Arthur’s work took an important first step, pointing out that fastball velocity decline is likely the best explanation for the penalty. However, there are a few pieces that require some revision:
- Arthur suggested that fastball velocity declined over the course of the game. This is mostly correct, but misses the most critical component: Velocity actually increases as pitchers approach the finish line, starting around pitch 100. This relates to the fact that it isn’t fatigue per se, but rather a starting pitcher’s pacing of his exertion levels.
- The fourth time through the order is the key to the whole story and should be discussed any time the TTOP is discussed. Arthur noted that “there is also still plenty of room for familiarity to play a role.” If that were the case, the fourth time through should be the worst time through.
The Fourth Time Through Strongly Suggests It’s Not Familiarity
Rob Arthur’s argument about pinch hitters not suffering from a lack of familiarity is a strong point, but it relies on a non-comparable sample. We’d be much better served to use a consistent sample, specifically the fourth time through the order. If familiarity were a factor, the fourth time through the order would be worse for the pitcher than the third time through. In case you haven’t guessed by now, that is most certainly not the case.
All numbers have been adjusted to account for the quality of the batter in the year in question, the home-away split, and the pitch type. This is key because the top of a batting order is better than the bottom. The data is split into two parts: contact quality, as measured by wOBA (for consistency with Lichtman’s work), and swings and misses (whiffs). All data are for starting pitchers only and exclude pinch hitters.
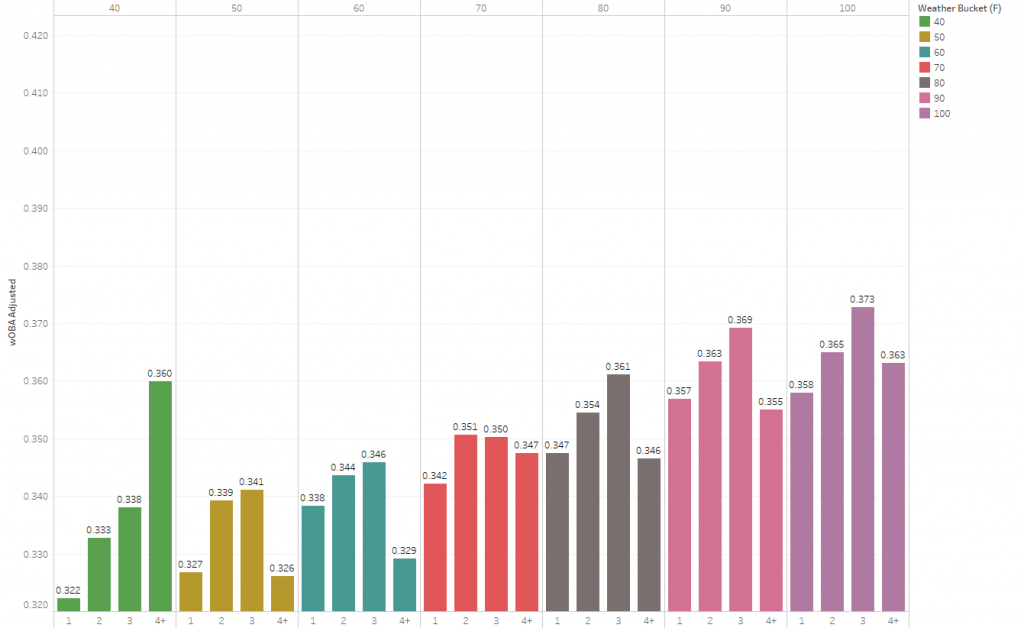
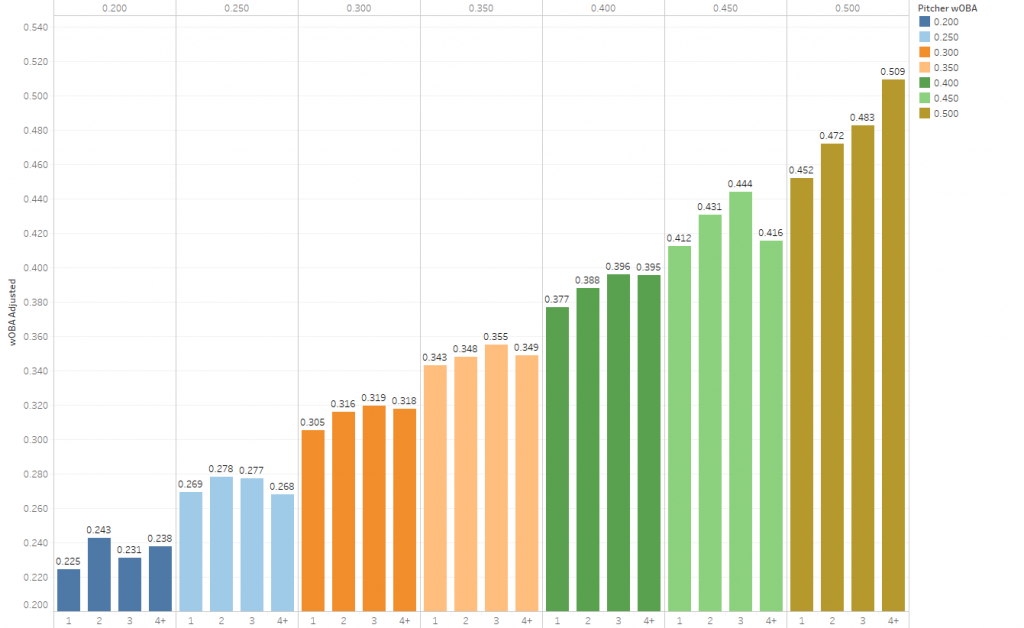
Exhibit A: Adjusted wOBA by Year and Times Through the Order (2005 to 2020)
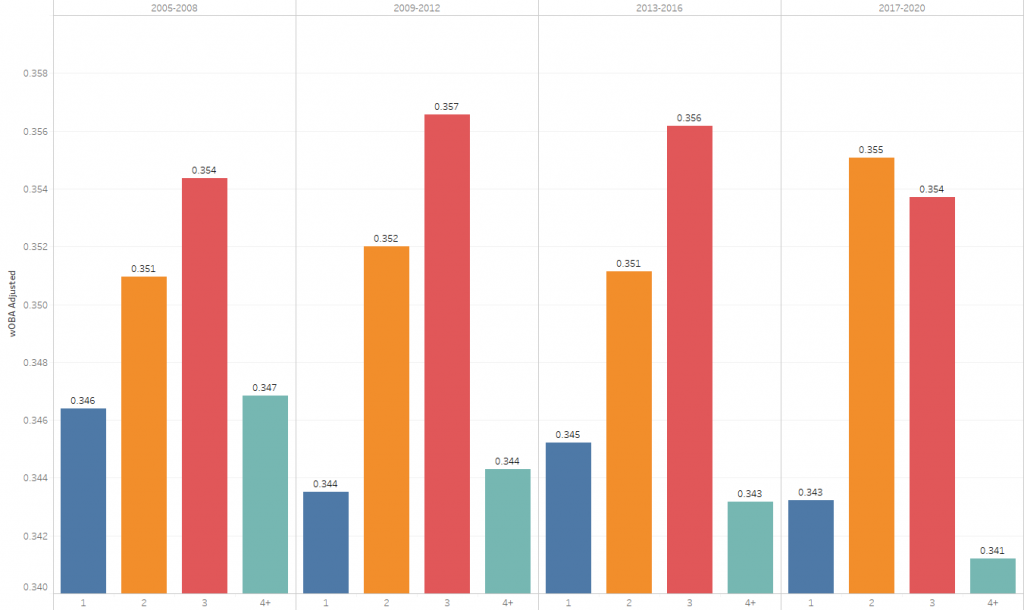
This picture tells the whole story: The fourth time through looks a lot like the first time through. If familiarity were at play, we’d see the fourth time with the highest wOBA on contact, but it is always lower than even the second time through the order, and sometimes even the first.
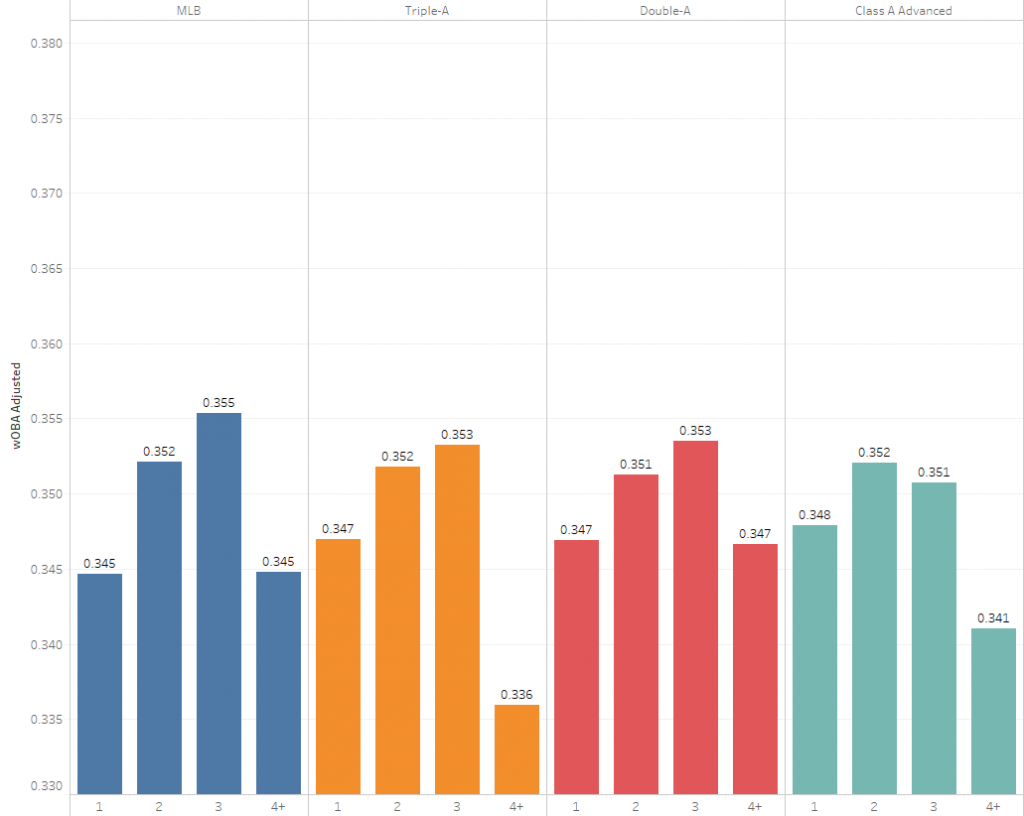
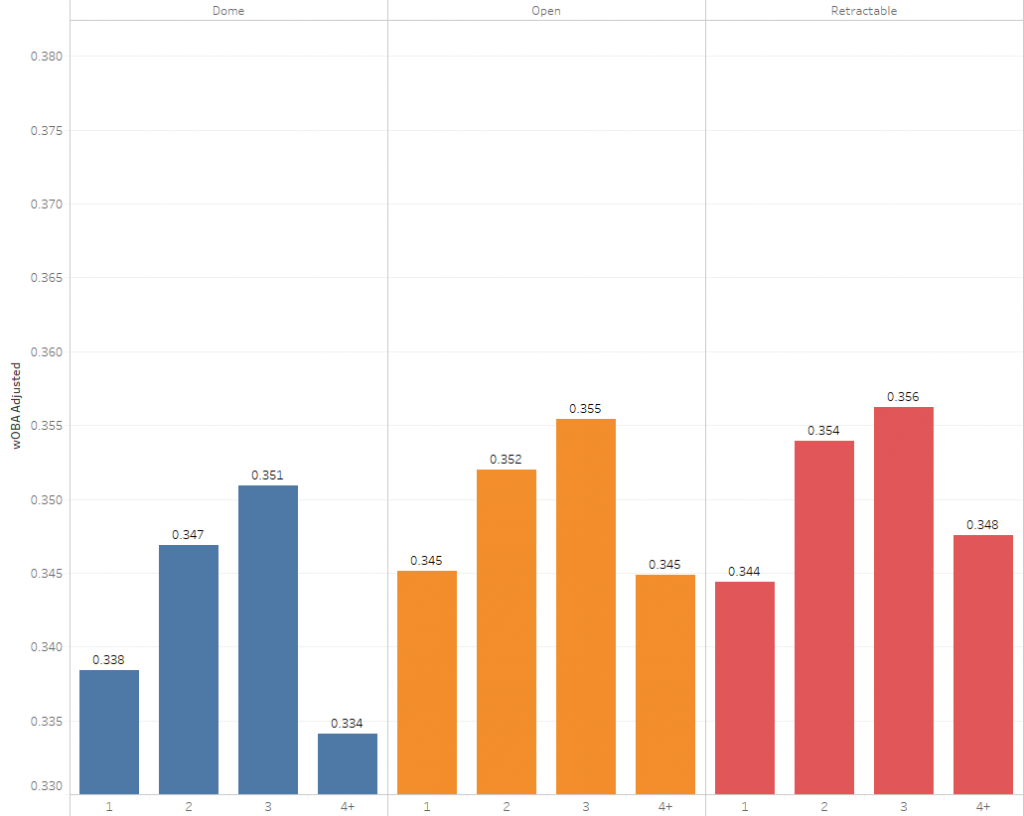
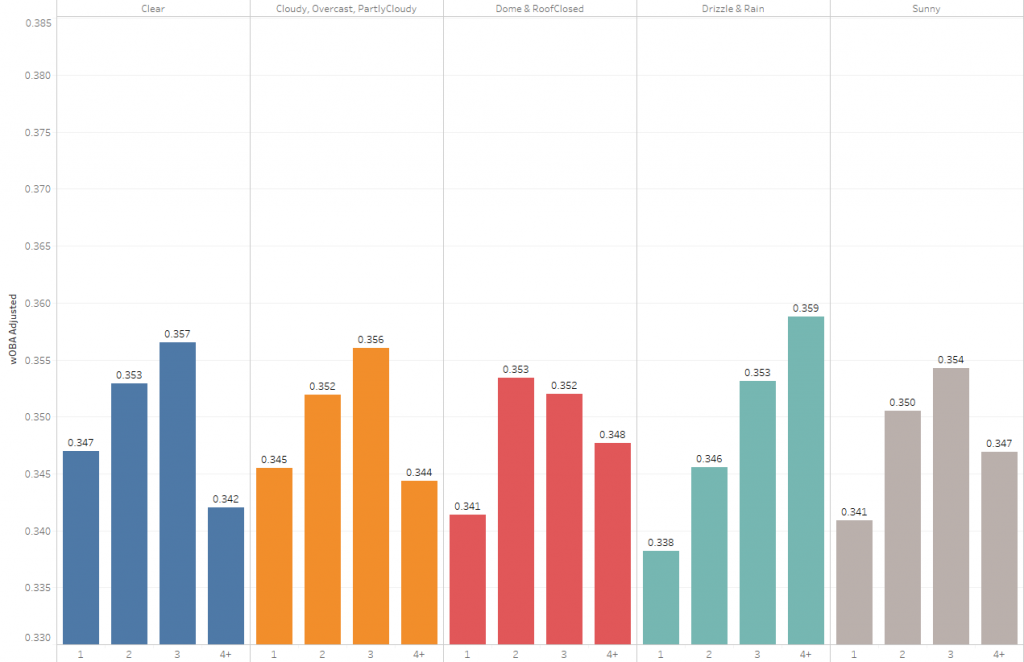
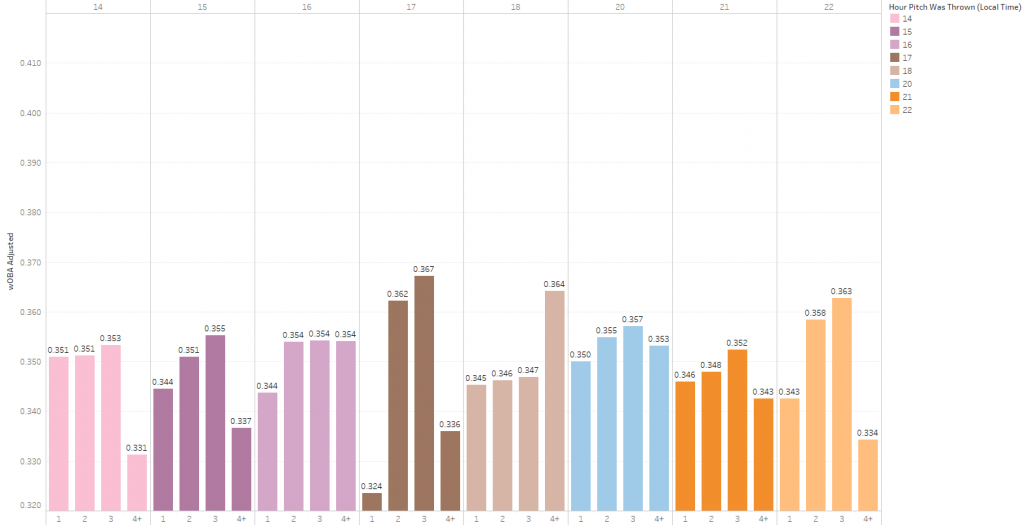
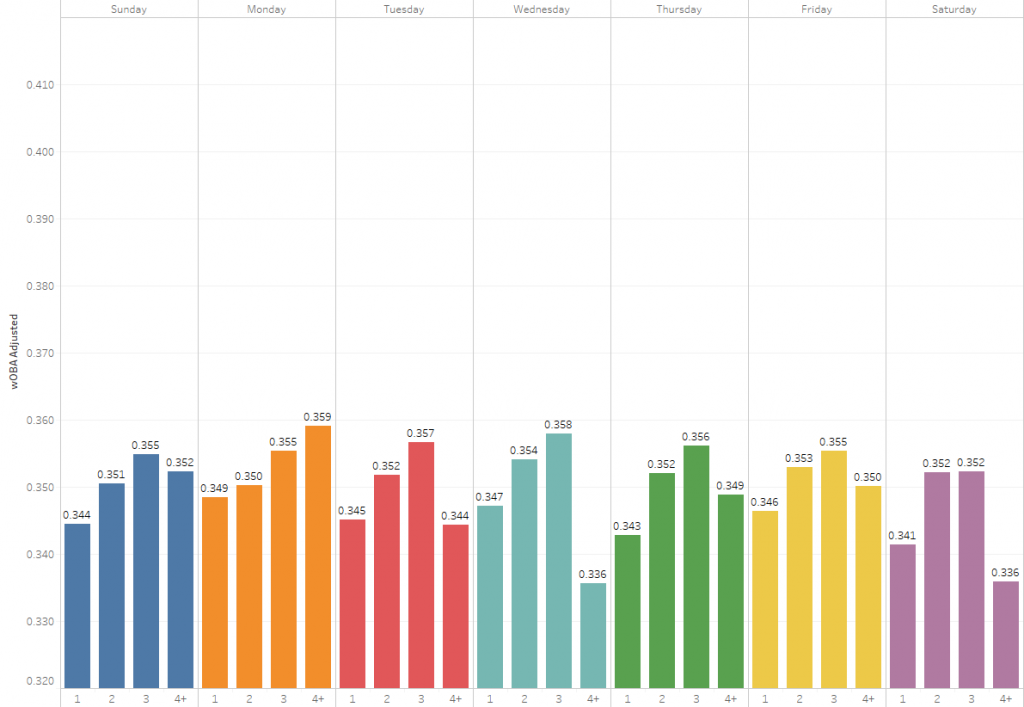
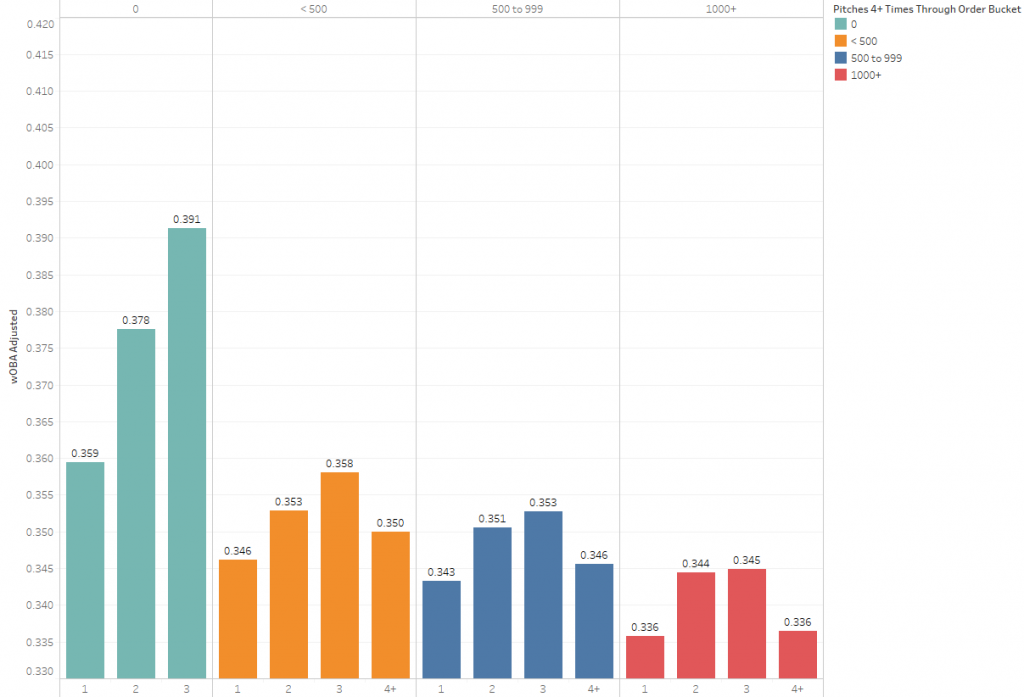
It should be noted that the above pattern persists across affiliated ball, in domed or open stadia, every hour of the day, Sunday through Saturday, rain or shine, good pitchers and bad pitchers. (See Appendix A.)
Exhibit B: Adjusted Whiffs by Year and Times Through the Order (2005 to 2020)
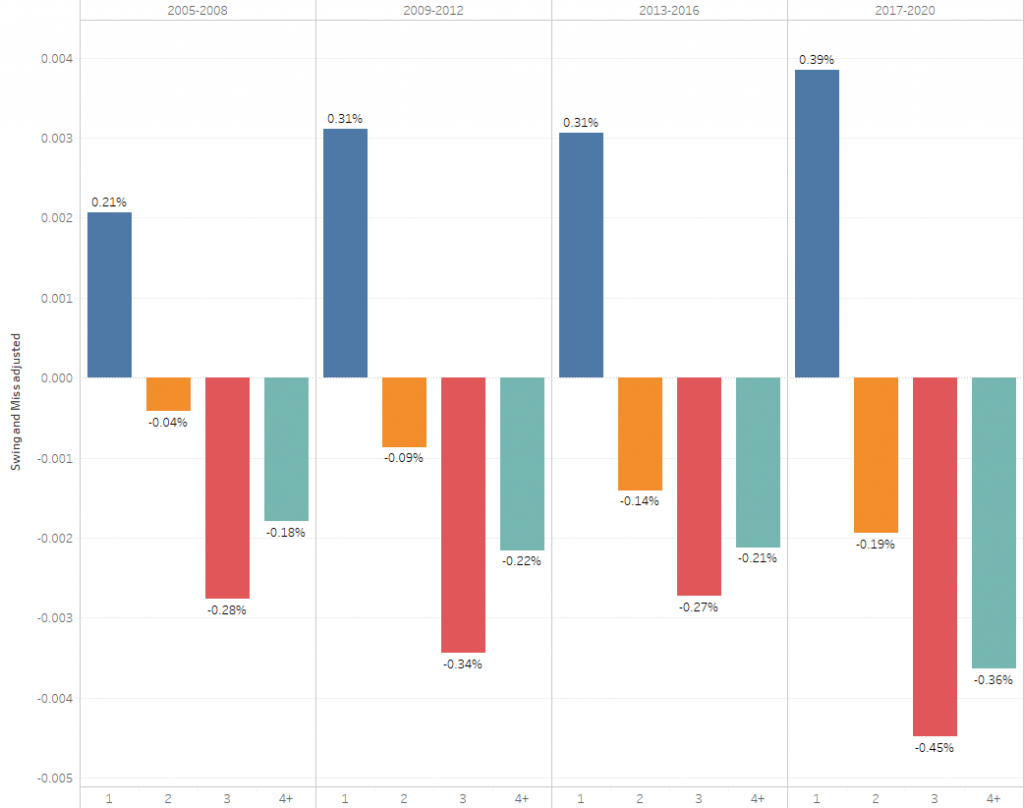
Here we don’t see quite as dramatic a shift as we did with contact, but the evidence is still quite clear: pitchers fare better the fourth time through than they do the third time through.
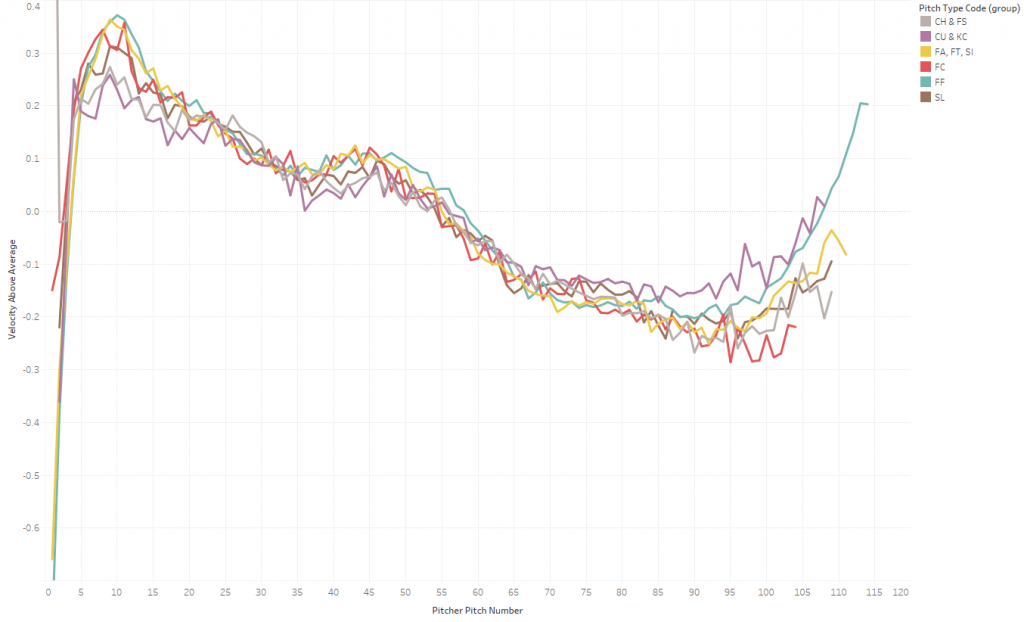
Exhibit C: Velocity Fluctuations Throughout the Game – The Key Factor
Pitchers vary their velocity quite a bit within innings and games. The following compares a pitcher’s per-pitch-type velocity with their average pitch-type velocity for that game. This is what the average starting pitcher looks like over the course of a game:
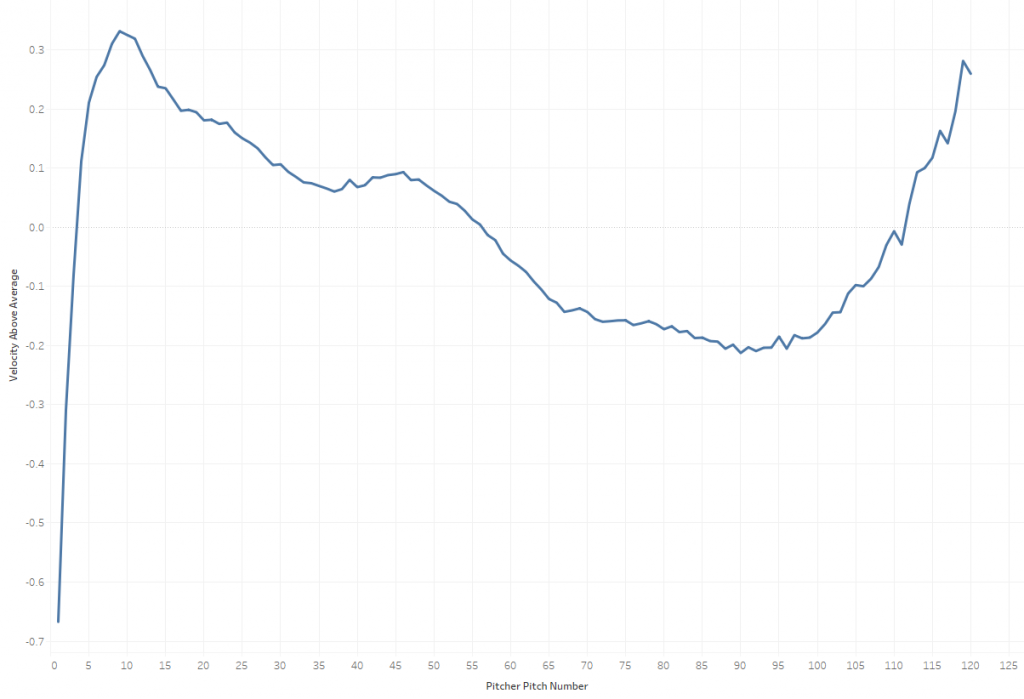
It’s a fascinating curve, starting with a roughly nine-pitch ramp-up, followed by a steady decline until about 100 pitches, where the pitcher seems to get a second wind and throws progressively harder as he approaches the finish line. While it may seem counter-intuitive that a pitcher would see an uptick in velocity later in the game, this is likely a pacing strategy, much like what an 800m runner would employ.
This shape generally persists across all pitch types:
The Link Between Relative Velocity and Contact Quality | R2 0.31
The importance of how much effort is put into each pitch is underscored by the relationship relative velocity has with contact quality. The following groups pitches by pitch number, then charts their outcomes to their relative average velocity.
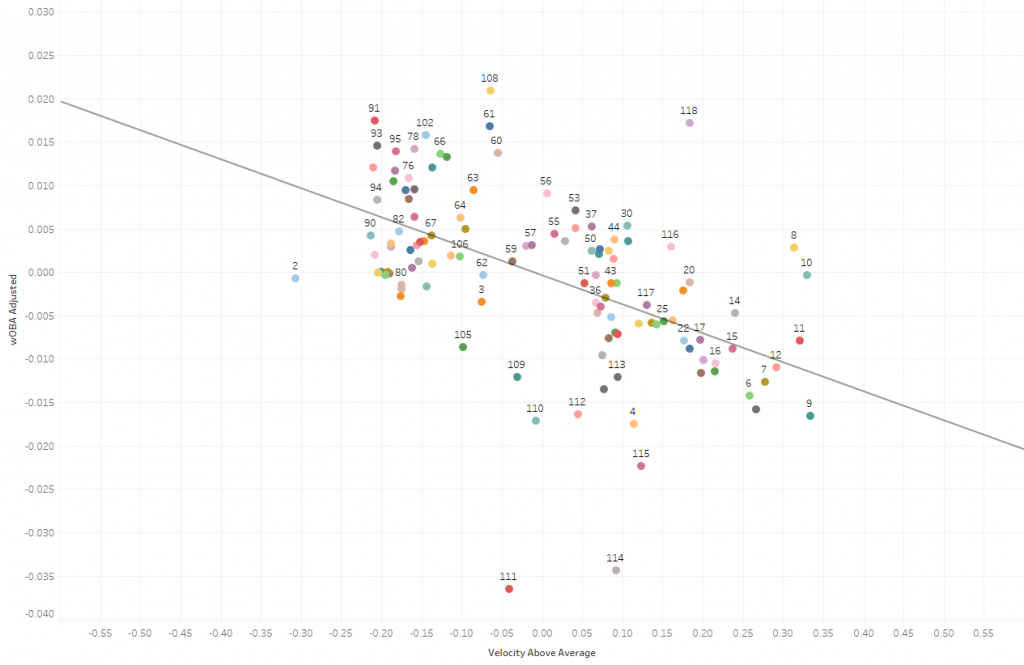
The ups and downs of a pitcher’s velocity within the game explain about 31 percent of the variability in contact-quality outcomes, after adjusting for pitch type, home/road split, and the quality of the batter that year.
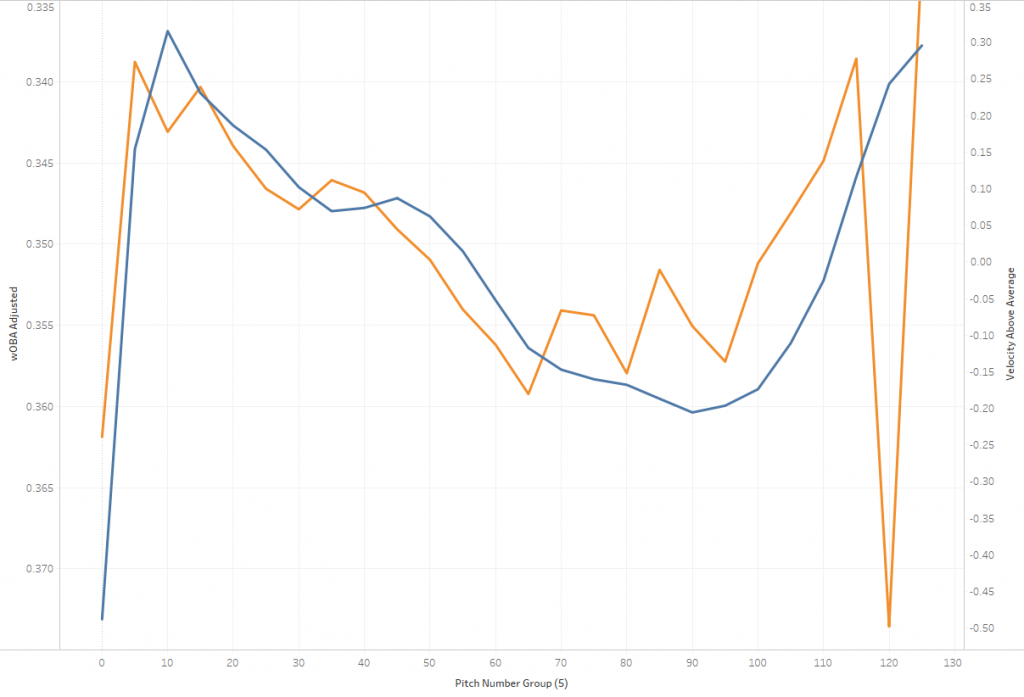
This is even more compelling if you chart them across pitch numbers, where the graphs share the same shape.
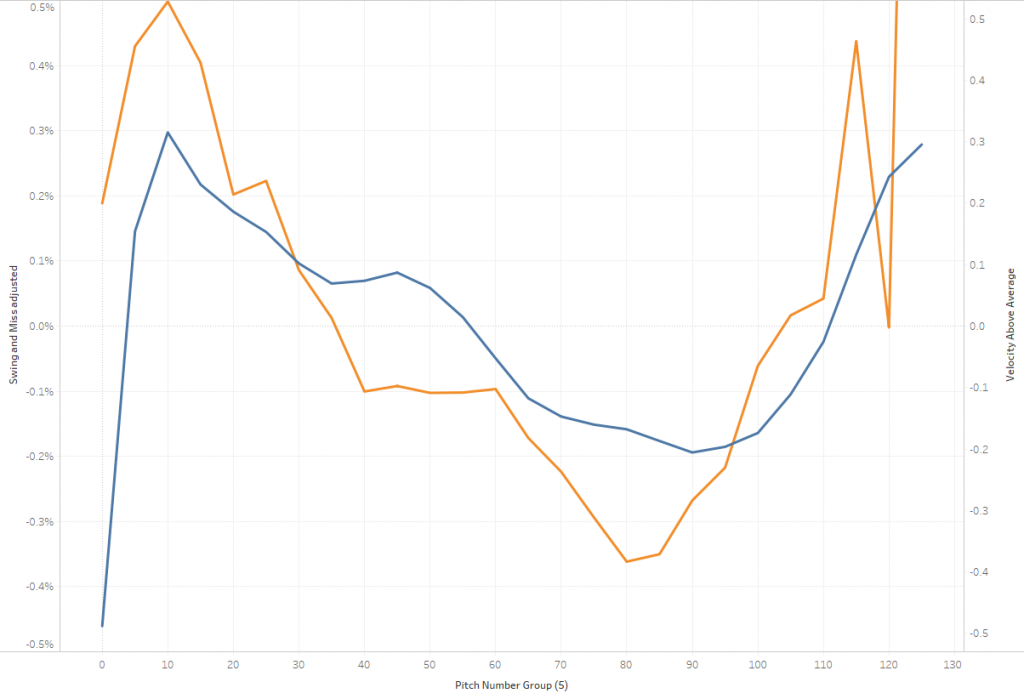
The Link Between Relative Velocity and Swing and Miss Rates | R2 0.44

The same analysis, when applied to swings and misses, suggests that the ups and downs of a pitcher’s velocity within the game explain about 44 percent of the variability in swing-and-miss outcomes.
As with contact quality, similarly shaped curves appear when charted together across pitch types.
Putting it All Together
The Times Through The Order Penalty maps very closely to relative exertion levels, as measured by in-game velocity fluctuations. If you map incremental velocity to whiffs by times through the order you get this:
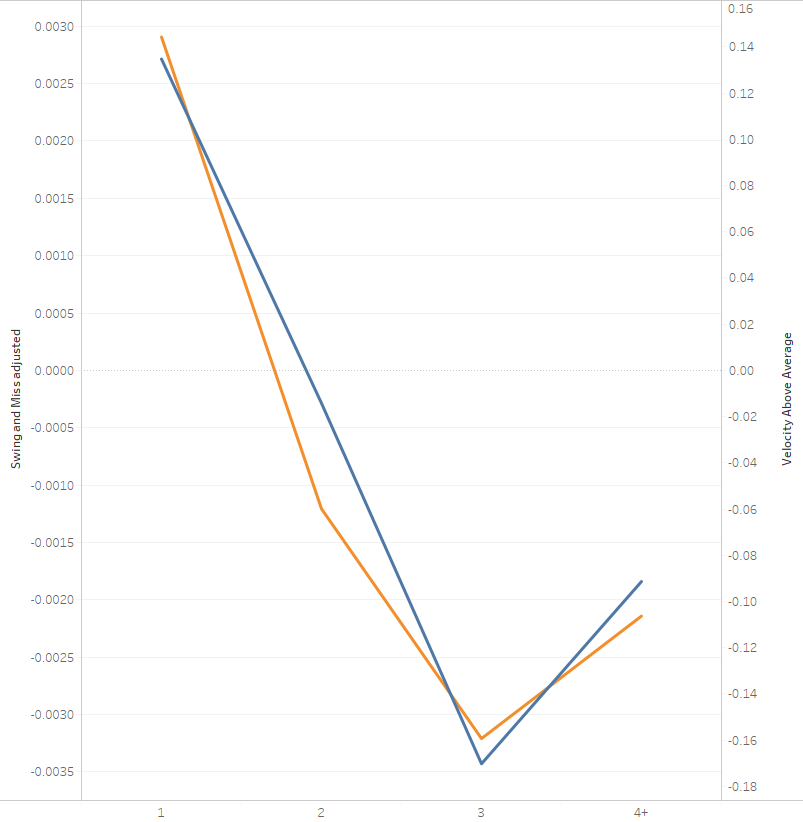
And for wOBA, this:

If anything, the fourth time through, when familiarity is at its theoretically highest point, provides relatively worse outcomes for the batter.
Concluding Thoughts
If seeing a pitcher more helped the batter, we’d see a consistent decline, including the fourth time through the order. Yet the fourth time through usually swings back in favor of the pitcher, implying that something else must be the driving factor. Relative exertion levels, as measured by a pitcher’s velocity changes within the game, map closely to performance, both from a contact quality standpoint and a swing and miss standpoint. Most importantly, this explains the critically important fourth time through.
Appendix A: Fourth Time Through Charts (Adjusted wOBA)
What else does this article prove?
Set up a series of simultaneous parallel games. After each inning (or maybe 2), the pitcher, catcher (who is familiar with the pitcher's stuff today) and a dedicated pitching coach, move to the next game over. As we get to the later innings, there is no batter familiarity, only pitching exertion/fatigue in effect.
There may also be a bias in that the manager allowed a pitcher to stay in the fourth time through if he's facing the bottom of the order. That shouldn't affect velocity but would affect wOBA, swinging strike%, exit velocity, etc. That could be fixed be looking only at appearances when the pitcher faces at least 36 batters (and ignoring batters past 36) but those appearances are rare and unlikely to be representative.
The pitcher gains would not be from an uptick in stuff but the opposite. It would be more like they have great feel and have been setting up those hitters all day long - its the only way you get that far.
Correct me if I am wrong, but this is all about treating situations as unique as opposed to gross generalizations. This is more like a counterexample to a flawed theory... which disproves it.