One of the common misconceptions about projections, or indeed sabermetrics in general, is that the entire project is some mystical computer process that spits out a bunch of numbers at the end. I won’t pretend to understand the ins and outs of the code that creates the projections—I’ll leave that to the experts—but I can talk about one aspect that has a very direct, easy-to-understand human component here at BP: Playing time.
There is no code in our projections that looks at a player’s history and the state of a roster and decides that they will receive 631 plate appearances or pitch 154 innings. This information is all drawn from the depth charts, which are updated manually to project shares of playing time at every position. We take into account things like track record, roster composition, and team tendencies, but there’s no magic formula. There’s plenty of art as well as science.
When you look at the PECOTA spreadsheet, you’ll notice a column titled “dc_fl”. This is the depth chart flag. If it’s FALSE, that means that the projection is based on a fixed hypothetical amount of playing time. If it’s TRUE, that means that the plate appearance total or innings pitched total you see is derived directly from the depth charts.
What that doesn’t mean is that myself, or my fellow DC admin Rob Mains, or any of our divisional experts, is putting an exact number on those plate appearances or innings. Instead, everything is broken down by percentages, and it’s our job to divide up the 100 percent at each position between the available players on every roster. Those percentages then get translated into the PA or IP totals you see on the DC pages, the PECOTA spreadsheet, in the Annual, or when you’re running the AX for your fantasy league.
It’s a zero-sum game. If one player loses 20 percent, that must be redistributed to other players. If a prospect gets called up and has to be added to the chart, we have to figure out where that time is coming from. It’s the same kind of thing that many fantasy players in particular will have done through mental arithmetic after a transaction, just in a formalized process. We’re making our best estimate of where a player will play, how much they’ll play there, and repeating that process for every player on the roster. The framework forces us to be rigorous and ensures that no player or team is projected for an impossible amount of playing time.
***
Let’s talk about exactly what you’ll see on the depth charts and how it translates to PECOTA. On each landing page (for instance, the White Sox), you’ll see four columns: the name of every player; their innings pitched or plate appearance projection; playing time percentage; and, for pitchers, their role. Pitchers and hitters are slightly different in that pitchers will be shown as percentage of games started (out of 162), or relief innings pitched, while hitters will have their percentage of projected time at each position we expect them to play, along with their individual PA projections at each position.
On the back end, we’re dividing up the playing time as outlined above. There’s an extra step for starting pitchers: innings pitched per game started. Prior history and team tendencies play significant roles in this. A workhorse like Lucas Giolito or Lance Lynn pitching for a team that seems unlikely to restrict them will get projected for six innings per start or more. The White Sox are unusual in having multiple players like that. In 2021, most starters are more like Dylan Cease, projected for an IP/GS in the low fives, or even below five altogether. Teams like the Rays are going to have a lot of these pitchers.
What does an individual position look like in practice? To take a specific example, and continuing with the White Sox, shortstop features Tim Anderson at 85 percent, Leury Garcia at 10 percent, and Danny Mendick at five percent. You might ask why Anderson isn’t higher. After all, he’s their star shortstop, right? It’s a question to which there are a lot of answers.
The first thing to know is that all of the hitting projections are in multiples of five. We don’t want to convey false precision by getting more granular than that. It’s also not really worth projecting a hitter if we don’t expect them to reach five percent (around 30 plate appearances), so it’s a sensible lower bound.
We never project that anyone will play 100 percent of the time at any hitting position, or that any pitcher will make every turn in the rotation. Hitters top out at 90 percent, and pitchers at 19 percent (31 starts), both projections quite rare. That’s not to say that we don’t think it can happen. It’s more a case of not projecting anyone at their most extreme outcome. Even if a handful of players never miss an inning on the field, or take the mound every five days, it’s not always the players you might think. Even with the true workhorse players—take Nolan Arenado, who between 2015 and 2019 averaged 157.4 games and 675.2 plate appearances annually—it’s not typically worth stretching beyond 90 percent, since even a minimum IL stint like he had last season will sap at least those 40 surplus plate appearances.
It’s also becoming increasingly rare. Teams are smart about their players’ health and cautious when it comes to aggravating potential injuries. They’re more likely to play matchups and aggressively optimize, whether it’s a platoon situation, defensive consideration, or a more nuanced decision based on a pitcher’s repertoire or hitter’s swing plane.
There was exactly one player who started all 162 games in 2019: Marcus Semien. Did Semien receive 100 percent of the playing time? He did not. There were eight games that he departed before the end, including the final game of the season in which he took a single token at-bat and then left before the bottom of the first. Semien played a colossal amount, taking 747 of the A’s 759 plate appearances at shortstop. When your most extreme example reaches 98.4 percent, it is not hard to see why we never project anyone at 100, or even 95.
Permanently staying on the field is not as sustainable as Cal Ripken Jr. might have led us to believe. An “ever-present” player like Semien couldn’t maintain that even with the benefit of an abbreviated campaign, dropping back to exactly 90 percent of plate appearances at shortstop in 2020. The thing about projecting at the extreme ends of distributions is that it takes almost nothing to render that outcome impossible. A single IL stint of the minimum length practically caps the ceiling around 90. All it takes is a niggling injury, or a few extra rest days at the end of the season, or a manager who likes to rotate. Players being removed mid-blowout or routinely swapped for late-game defensive replacements can even have a bigger effect than you might think.
Beyond the constraints at the high end, there are many more reasons why players might be projected to play less—or more—than you think, including:
- Track record of regular playing time
- Extended injury history, or recent ongoing health concern
- Roster status, such as whether they are on the 40-man, have options, or are a Rule 5 pick
- Roster composition and flexibility
- Performance trends
- Managerial and front office tendencies
- Specific situational considerations, like platoon splits or defensive capability
To return to Anderson specifically, there are a few competing factors. He’s obviously the team’s de facto starter and they’d like him to be out there every day if health was not a factor. On the other hand, he has been on the IL in each of the past two seasons, has only reached 150 games in one campaign, and even in that season he received 92 percent of the plate appearances at short. Shortstop is a more demanding position than, say, first base, where we’re more likely to project a 90 percent.
In light of his recent playing time you could even say that 85 percent is too aggressive, and a projection system that purely determines playing time based on past PA totals would likely be more negative. Anderson’s age, offensive improvements, and clear edge over the available alternatives mean that we’re comfortable with an 85, which is essentially what most established major league regulars get if they haven’t got a proven baseline of 90-plus percent.
It is even more difficult for a pitcher to get into 30-start territory. Here’s why:
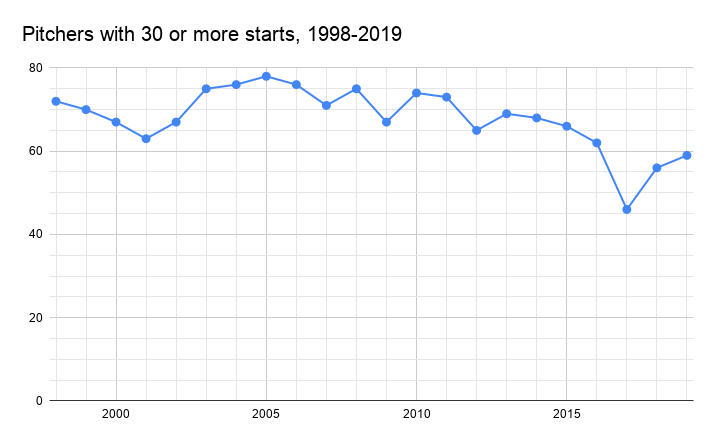
Not so long ago, over half of the 150 rotation spots went to pitchers who made 30-plus starts. Now we’re lucky if it’s well beyond a third. The four lowest totals since the expansion to 30 teams came in the last four full seasons. The shortened season did not offer an opportunity to extend that streak but, if anything, is likely to suppress the trendfurther in 2021.
There’s an additional factor to consider: repeatability. We might think we can count on pitchers to repeat, but of the 56 starters who made 30 starts or more in 2018, only 25 did so in 2019. If under half of the ‘durable’ group go back-to-back, it highlights how important it is to be conservative. Pitching is often bad for your health. You therefore won’t see more than around 20 pitchers in the 30-start region this year, especially with the uncertainty created by such a brief preceding season.
As is so often the case with projections in general, this might sound like we’re trying to bring you down. This is the unfortunate effect of attempting to take a balanced approach that is aiming for the median outcome, not the optimal one. Like the performance side of the projections, there will be misses in both directions. Some players will make every turn in the rotation. Someone might start every game. It’s just not that likely to happen.
Thank you for reading
This is a free article. If you enjoyed it, consider subscribing to Baseball Prospectus. Subscriptions support ongoing public baseball research and analysis in an increasingly proprietary environment.
Subscribe now
Is the idea that their projections are scaled to a 600 PA season - for comparison's sake?
So, I should exclude the projections for players with dc_fl = FALSE when valuing players for fantasy baseball purposes -- again, "obviously, right?"
Just making sure I'm picking up what you're putting down. Thanks