Today is PECOTA Day, the first day of PECOTA Week.
Each season, we provide an overview with an eye toward current topics of interest.
This year, we will touch on three topics: (1) the challenges presented by the truncated 2020 baseball season; (2) the usefulness of PECOTA’s percentiles; and (3) improvements to our batted ball projections.
The 2020 Season, as Applied
It is important to acknowledge the challenges presented by the 2020 season. MLB schedules were shortened to 60 games. Minor league games were essentially not played at all. In the MLB games that were played, offense was suppressed, although walks were also issued at historic rates. Several players opted out of the season entirely. New umpires added a level of variance to strike-calling that we had not seen before.
Should these oddities change the way we model future baseball performance? From our standpoint, the answer is “no.” There is little we in the public sphere can do about minor leaguers who play no public games. As far as major leaguers go, the 2020 playing environment is what it is, relative to previous seasons, and a decision admittedly does have to be made as to the likelihood of that environment repeating itself. But that decision has to be made every year in some form, and as index stats have become more popular, pinpointing the raw averages has become less important. Although smaller samples do increase uncertainty, a good projection system should take this in stride: A certain amount of performance is still available for consideration, the timing and pervasiveness of that performance is a matter of record, and a projection system should have rules for such things that, on average, deliver reasonable results.
The incorporation of Statcast inputs by PECOTA admittedly makes it easier to deal with smaller samples. PECOTA does not rely upon a player’s average launch angle or exit velocity like other systems might, but does incorporate other summaries of those measures—which we have found to be more informative.
In light of these challenges, one frequent topic of discussion in the projection community has been on the best “weight” to assign to 2020 player performances. Weights-based projection systems are both traditional and convenient, and can produce reasonable results (provided that the analyst chooses the correct weights). But a weight-based system also tends to treat a player’s future performance as almost exclusively a product of his past performance (plus some shrinkage). This could compromise accuracy, because players provide us only individual departures from overall performance trends across baseball; put another way, every single player is an overfit data point. If you subscribe to the notion that everything outside of individual previous performance is completely Random Variation[1], then perhaps you see no alternative to an explicit, weights-based approach. On the other hand, if you believe, as I do, that there is no such thing as random variation in baseball, or really any other sport (actual coin tosses excluded), then this justification is not persuasive.
Beginning with the 2020 season, PECOTA has approached projection from the opposite standpoint. Instead of setting a priori weights, PECOTA models what it sees as the overall system of baseball player performance over the past several seasons, regardless of whether those players are expected to play major league baseball in 2021. PECOTA looks for underlying trends driven by all players, and treats individual players only as partial, probable deviations from those trends. As such, there is nothing special about 2020 MLB performances as far as PECOTA is concerned, as compared to other samples of similar size. The weight ultimately placed on individual previous performances is determined by the demonstrated connection between such performances and future performances, not because we have decided to assign it some particular value.
This approach does not guarantee that PECOTA’s conclusions are correct, but we prefer a system that does not require us to select how past performances ought to be weighed.
Variance as Confidence
One of PECOTA’s distinguishing features is that it tells you not only our expectation for how a player will perform, but also the probabilities—yes, they are probabilities—of the same player offering a higher or lower level of performance. Although it is always good to know how certain a projection is, PECOTA’s uncertainties actually vary greatly from player to player, and readers who rely on PECOTA can benefit from those uncertainties in deciding how volatile they want their individual rosters to be, whether those rosters are being used for fantasy baseball, daily fantasy sports, or, umm, other pursuits.
Consider two pitchers who are both highly-regarded, albeit in different ways: Clayton Kershaw, multiple Cy Young award winner and future hall-of-famer for the Dodgers, and Michael Kopech, a young pitcher for the White Sox who many believe has a bright future but who also has struggled to get his career going, in part due to injuries.
PECOTA thinks that Kershaw will be exceptionally good, and that Kopech will be slightly above average. In that respect, PECOTA may not differ much from other projection systems. But PECOTA gives you more than just point estimates. PECOTA also gives subscribers a distribution from 1st percentile outcome to 99th percentile outcome. Using DRA as an example, if we approximate the distribution implied by those percentiles, PECOTA’s uncertainty about these two players is remarkably different:
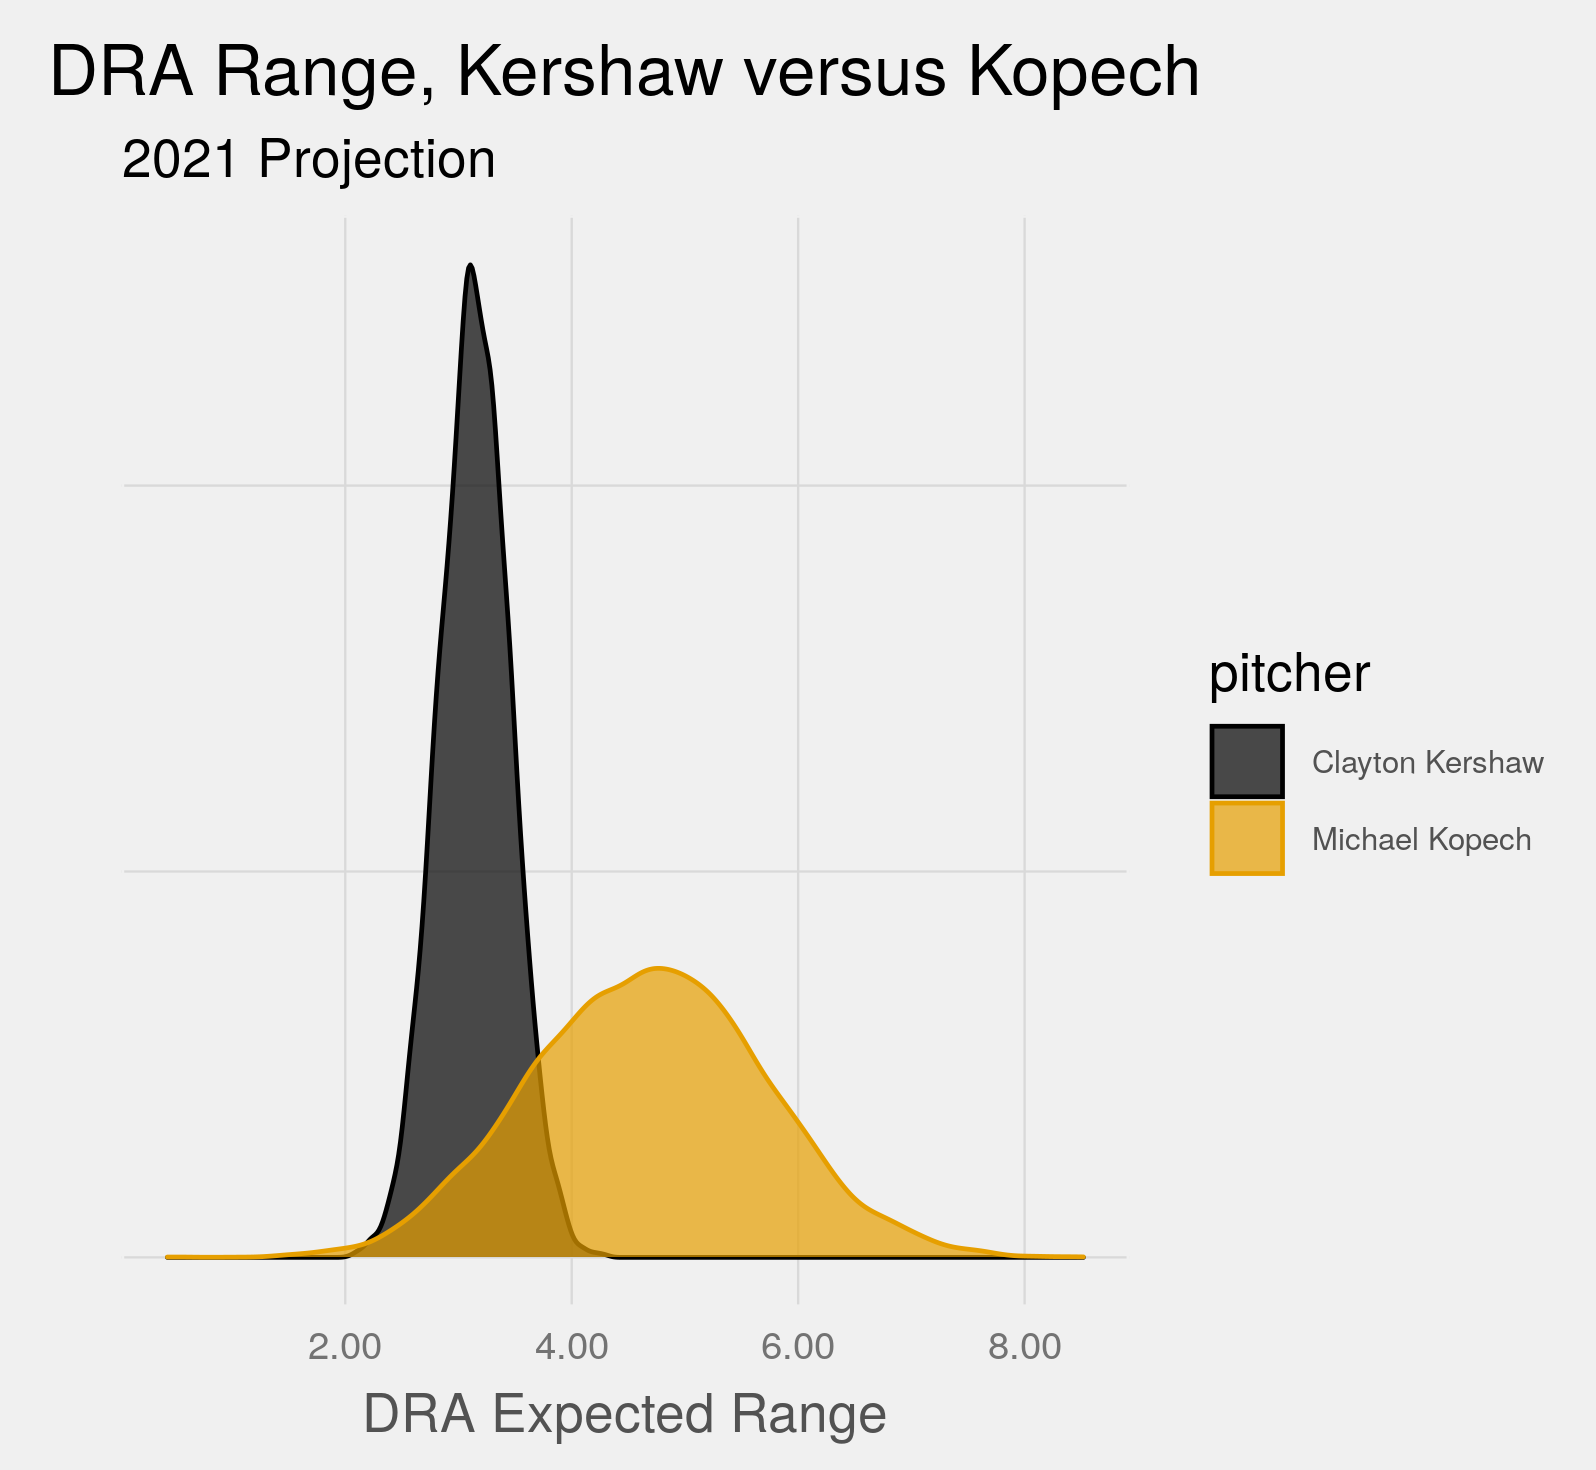
Kopech presents a massive amount of uncertainty. PECOTA would not be shocked if he is fantastic, would not be shocked if he was terrible, but on balance expects him to be decent. Kershaw, on the other hand, has an extensive record of considerable accomplishment. His track record is so strong that it is virtually inconceivable he could end up being merely average, and his projected median DRA—remember, DRA is on the RA9 scale—is just over 3.
You can find similar disparities in uncertainty among batter DRC+ as well. These same percentiles are offered for all of the batting events that PECOTA projects.
The usefulness of uncertainty goes beyond broad questions of roster construction. Many readers may not be aware that when you simply average a series of values, you are actually assuming that the values all have the same level of uncertainty. As we have just seen, that assumption is not true, at least with PECOTA, and thus those who merely average projection point estimates are leaving extra accuracy on the table. With just two players, the average of the two distributions will admittedly be awfully similar to their raw means. But if you start adding a number of players to a roster, you will find that the “correct” average value of your lineup can be a few ticks off what their midpoint values would suggest. To some people, this distinction will make no difference, but if you happen to be involved in activities where a few points of ERA or an extra home run or two can make a big difference, you should consider using projections that give you this added bonus.
Correlation and Collaboration
Each baseball batting event can end in a variety of outcomes. PECOTA projects the rates for several of them, for both batters and pitchers:
- Groundballs
- Strikeouts
- Walks
- Hit by Pitch
- Infield Reached Base on Error,
- Singles
- Doubles
- Triples
- Home runs
For simplicity, baseball statistics have traditionally reduced these possibilities to a so-called “binomial” (technically, a Bernoulli) event: The batter succeeds or he fails (think of batting average, on base percentage, etc.). Of course, we have come to recognize that this is an oversimplification, because while failure (out) types have similar run values (broadly speaking), the run values of successes vary quite a bit. For example, home runs are much more valuable than singles, even if a team up to bat would be delighted to have either one.
To track different types of success, we need to distinguish between multiple types of outcomes. Although this multiclass output is often described as a “multinomial,” it would be more accurate to describe baseball’s batting events as forming a categorical distribution: multiple discrete outcomes, but only one can be selected at a time. The terms “categorical” and “multinomial” are often used interchangeably, but they technically are not the same thing.
When projecting baseball events, you want to be sensitive to the fact that these differences between categories matter. But ideally, you would go beyond that: There are also correlations between these categories that help them predict each other. Batters who hit a lot of extra-base hits often do not hit as many singles, and vice versa. Batters who do hit for power often have elevated strike rates, and so on. Unfortunately, the dirty little secret of categorical / multinomial distributions, is that, typically specified, these categories are mathematically prohibited from communicating with each other.
This is because the standard way to model a categorical outcome is by using multinomial logistic regression, which typically involves a series of binomial comparisons over a reference category, and then transforming the results back onto one scale. Multinomial logistic regression is extremely powerful: It is a major part of what distinguishes DRA- and DRC+ from other metrics measuring the same types of events. But even when using multinomial logistic regression, you still have a ceiling: Tracking correlations between outcomes is not permitted, and parametric regression methods that do allow for correlations (such as multinomial probit) are a computational nightmare. (You can also use machine learning methods for multiple outcome problems, but they bring their own disadvantages).
Even without accounting for correlations, logistic regression (binomial or multinomial) works well. If you are properly modeling the individual components, many of these correlations should show up anyway in your results. But it sure would be nice to consider it all at once, because it can only help.
For this reason, one focus of PECOTA this offseason was to investigate ways to get our batting events to engage in social activity with each other. We considered all sorts of ideas, and even some rather exotic distributions. But we finally settled upon something that appears to work quite well. Our projected components now benefit explicitly from connections between each other, and the result was a noticeable jump in the accuracy of our batted ball component projections, at least when back-predicting older seasons. In fact, we find that our park-neutral batted ball projections now consistently match or exceed the accuracy of other projection systems which do have a park-factor applied, which means that PECOTA’s batted-ball projections have nowhere to go but up. Our new system of park factors, which will be announced later this week, will provide the opportunity for even more accuracy.
[1] The concept is so well-ingrained in baseball discourse that it has become a proper noun.
Thank you for reading
This is a free article. If you enjoyed it, consider subscribing to Baseball Prospectus. Subscriptions support ongoing public baseball research and analysis in an increasingly proprietary environment.
Subscribe now
Brilliant and well put.
Just curious -- not argumentative. (And I assume that you're talking about the difference between something that is unpredictable and something for which there are no explanatory variables -- correct me if I'm wrong.)
I say there is no such thing as random variation in baseball because every result is directly influenced by some series of actions taken by players: the ball is thrown, the bat is swung, the ball is struck, it heads off in a certain direction, and it is eventually fielded. These are not random acts, but a series of highly complex, deliberate acts that culminate in a result.
People often describe this highly complex system as reflecting "random variation," but I suspect they are confusing the idea of a system that is complex beyond our understanding with one that is the equivalent of a lottery. The two are not at all the same.
Statistical methods that *presume* random variation perform well in many baseball and other sports problems, and this no doubt contributes to the idea that random variation actually exists in sports. But this statistical convenience does not mean that baseball processes are *actually* random; it means that you can better understand at least some of the system by *pretending* that baseball processes are random. Many processes behave at times as if they are random, and we can take advantage of that; but this fact does not make those processes random.
So-called "random variation" often is just information we do not yet understand. Some of what was previously dismissed as random variation has now been actually accounted for by advanced modeling techniques, indicating that some of the underlying information was not random at all. As we learn more about the science behind sports, we are not discovering random acts, but explanations better describing the underlying processes.
It is a fun philosophical discussion, but I think the shibboleth of random variation would benefit from some fresh scrutiny.