While the league was busy reckoning with the pandemic, labor strife, a strikeout epidemic, and half a dozen other issues, a strange and underappreciated trend was unfolding. The game’s batting average on balls in play, which had been steady from 2013-2017, fell from .300 (in 2017) to .292 (in 2020). The drop in BABIP in 2020 could be dismissed as a small-sample size, weird season abnormality. Nothing about last year was typical. But more than a quarter-season into 2021, BABIP isn’t just low—it’s fallen even compared to last year and currently sits at the lowest mark (.289) since 1992.
Although it’s hard to prove definitively, improved defensive tactics look like they may be partially to blame for the historic falloff in BABIP. Just as batting average was drying up, teams look to have been repositioning their fielders across the board, pushing nearly every position back a few steps. The positions that moved back most—third basemen and center fielders—appear to be responsible for almost the entire decrease in BABIP in the last few years.
I’ve written before about one kind of defensive positioning improvement. Since 2015, six teams adopted the rather-obvious tactic of shifting their outfield alignment left or right depending on the handedness of the hitter. This one weird trick was associated with, on average, a 10 point reduction in overall BABIP on balls hit to the outfield.
But there’s more to positioning than adjusting alignment for pull hitters. Unfortunately, we are severely limited in what can be divined with the publicly-available stats. There is another metric available, however. Although Statcast doesn’t release information on where batters stand on each play, Baseball Savant does host the average depth of each player on the field.
It’s hard to know how reliable this data is on a play-to-play basis, but aggregating over entire seasons protects against some forms of error: an average over hundreds of thousands of plays is unlikely to be swayed by a handful of aberrant measurements. By collecting these averages each year since 2015, it’s possible to see how the league’s overall positioning has evolved since then.
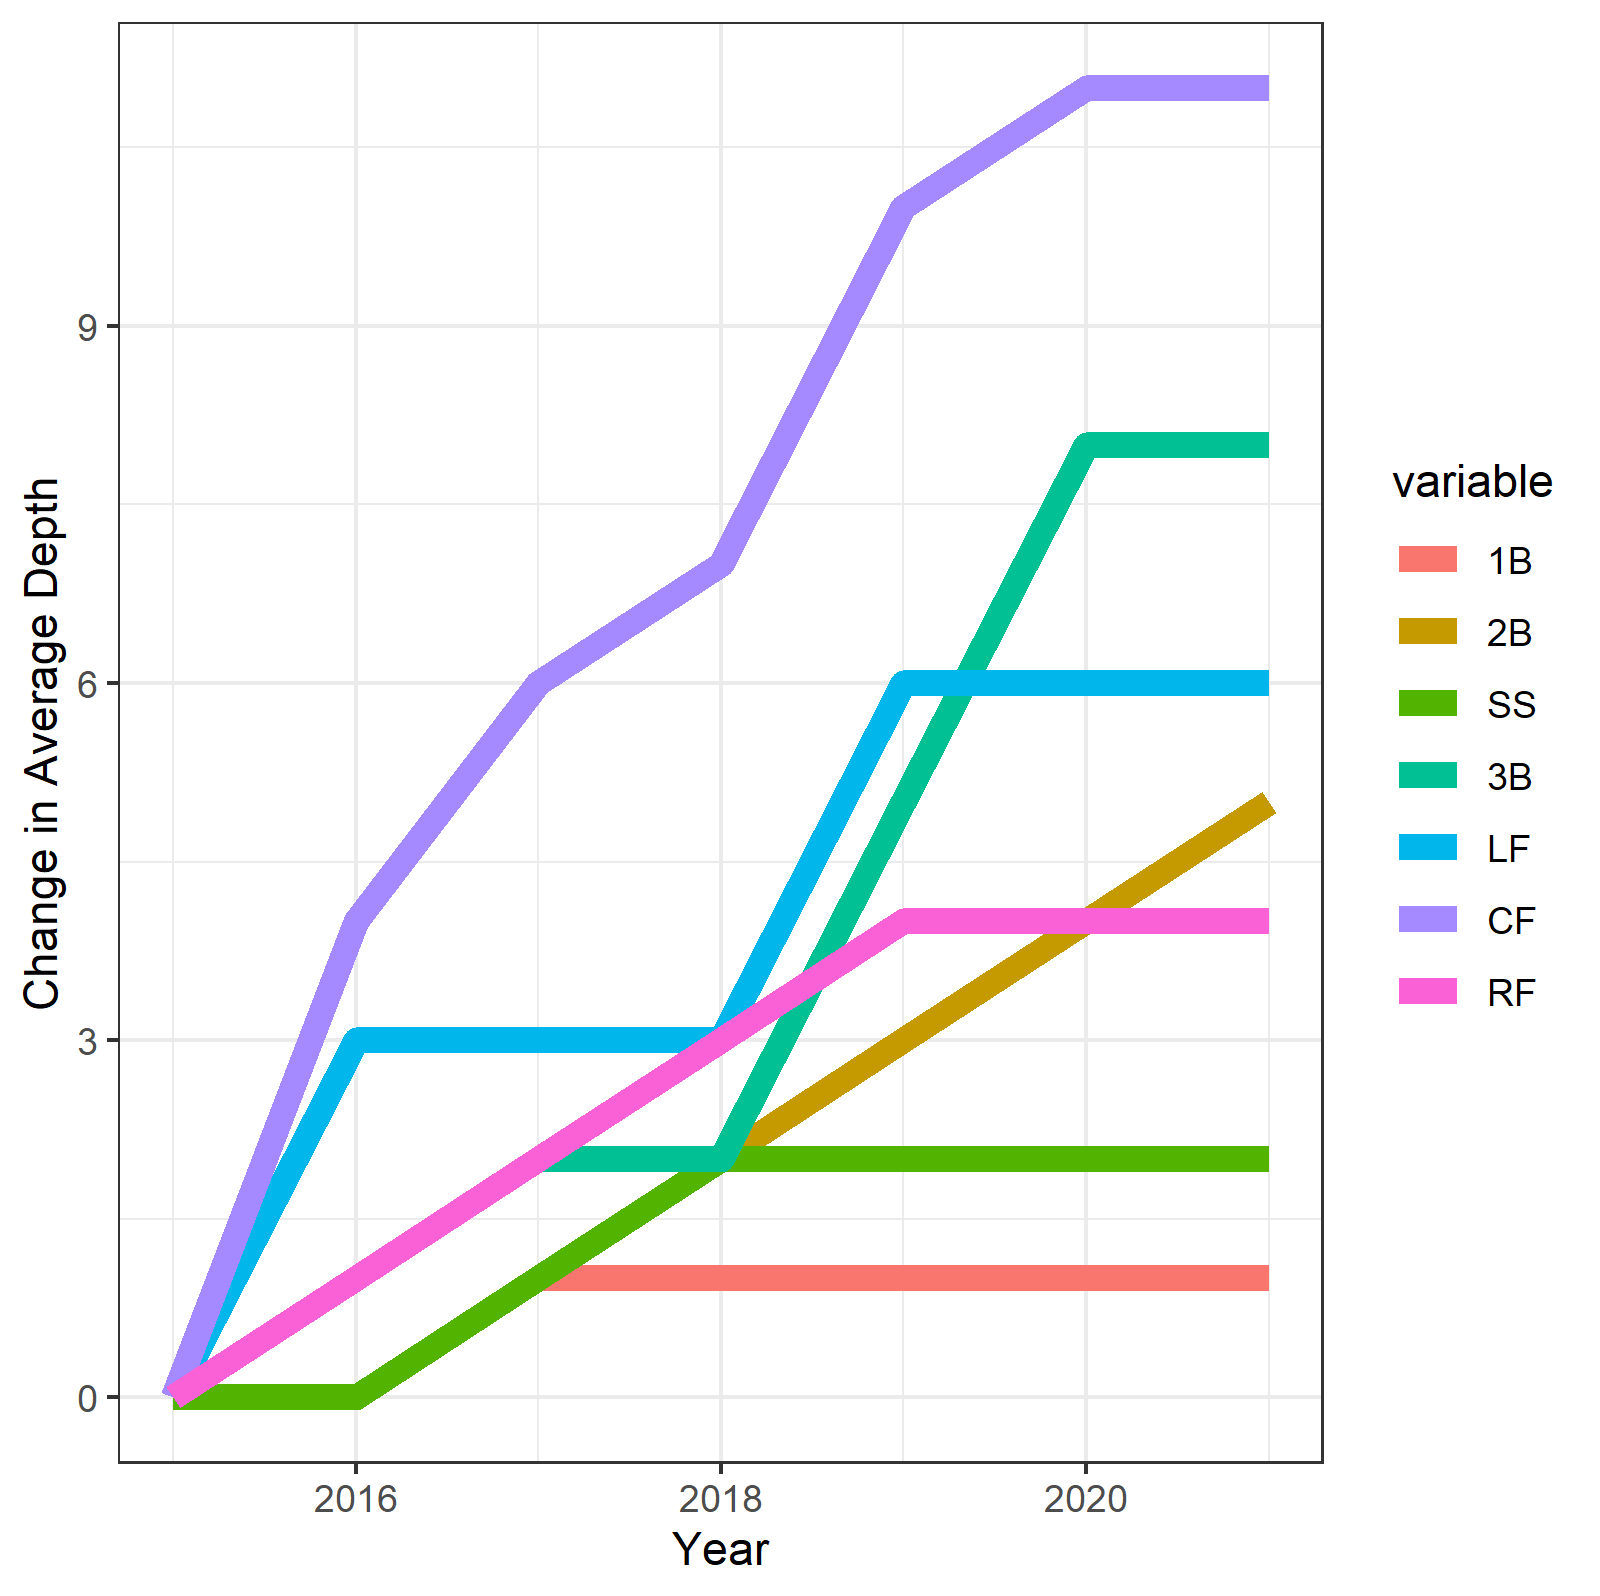
Most positions have moved six or fewer feet. First basemen have barely budged, which makes sense since they are more anchored to the bag. Only two positions have changed by as much as eight feet: third base and center field. Center fielders have moved by far the most, shifting towards the outfield wall by 11 whole feet.
Third basemen have also moved progressively back since 2015, from 110 feet to 118. This step is not a product of the shift. Even on plays without any shift in place, 3Bs are back 10 feet since 2015. Center fielders have the largest step backwards of any position, by a fairly wide margin. They’ve moved back some 12 feet since 2015.
Have these changes worked? The data suggests that outfield defense has improved significantly since 2015. BABIP is down on liners and flies to the outfield. Batted balls that used to fall for hits are turning into outs instead. But let’s get more granular than overall performance.
If positioning improvements are truly to blame for some of the decline in BABIP, we ought to expect that the two positions that shifted the most might have some of the largest improvements in defensive efficiency. In fact, the real change is even more amazing: balls hit to third basemen and center fielders have dropped by almost 40 points of BABIP since 2017 (and 40 points of wOBA). Balls hit to literally every other position on the field have barely budged over the same timeframe, increasing BABIP by .003 and wOBA by .006. The two positions with the largest changes in where they stand are responsible for nearly the entire improvement in defense since 2015. (It’s worth noting that exit velocity has actually increased in this timeframe, so batted balls have become a little bit harder to field overall.)
Teams we tend to regard as the most sabermetrically advanced have even deeper-playing outfielders and center fielders in particular. The Astros moved their center fielders back 16 feet and their right and left fielders 13 and 14 feet. The A’s play their entire outfield more than 300 feet back while most teams’ left and right fielders average around 290, even though the walls aren’t much further from home than a typical ballpark. The ever-contrarian Rays actually moved against the tide, bringing their center fielders in some eight feet since 2015; they’re still above average compared to the rest of the league, despite calling them in.
Once you start looking at individual teams, the specifics of who’s playing what positions and how fast they are become much more important. For example, the Rays have had the defensively-excellent Kevin Kiermaier manning center field for most of the last decade; is their aberrant trajectory due to Kiermaier’s still-exceptional speed? Or does the Rays’ ahead-of-the-curve positioning help explain why Kiermaier consistently rates so well in most defensive metrics?
Separating the chicken from the egg becomes almost impossible for any given team. But across the league as a whole, there aren’t enough unusual players to explain why center fielders and third basemen got pushed several paces back. That was likely a strategic choice, one that led to a massive improvement in BABIP for these two specific positions.
This finding leaves us with more questions than answers. If all defensive positions moved back, why did third basemen and center fielders move so much farther back? What made their positioning especially flexible and why did their efficacy improve so much more than other players? Moreover, was improved positioning the cause, or merely a correlate? More research and better data is necessary to answer these queries, as well as an approach that goes further in examining the fate of each batted ball as a function of its speed, angle, and direction. In next week’s article, I’ll try to take it a step further and isolate which batted balls that used to be hits are now outs, and what that can tell us about how the league has adapted its defenses.
Thank you for reading
This is a free article. If you enjoyed it, consider subscribing to Baseball Prospectus. Subscriptions support ongoing public baseball research and analysis in an increasingly proprietary environment.
Subscribe now
Here's my post with the findings: https://forum.soxprospects.com/post/457770