
We are almost three months into the season, and while preseason projections remain a much better guide to the future than current-season stats, ideally our projections would still benefit from them. But this is easier said than done. Pre-season projections provide years of perspective. How do we value what we have learned in the short span since then?
Clearly, we need to combine what we knew before and what we’ve learned since. Logically, you would apply more weight to preseason projections early on and less as the season continues. But what is “more” and what is “less”? What is the principled basis for the chosen weights? You can devise something that works “on average,” but that doesn’t mean it actually works that well. And please don’t rely on “stabilization,” if people can even agree on what that means.
Although we want a weighted average of projected and actual performance, we also want to treat different players differently. For a player with a long track record, our preseason projections should not be diluted by an unusual month. But for a player with a volatile or short history, we should be more deferential to recent performance. In sum, we want our inputs to be weighted by the amount of information each of them provides, and we want our approach to adapt individually to each player.
The good news is that this sort of update is not only possible, but actually straightforward, provided that you are using PECOTA projections and our deserved batting event statistics. If you are a Baseball Prospectus subscriber, we’ve already done the math for you and pushed the results out to The Ax and our Scoresheet Draft Aid (SSDA). Below, we’ll even show you how to perform these updates for yourself.
First, we’ll discuss how information-based updates work and why they can be so important.
Statistics as Information
To begin, let’s consider how even noisy statistics can become trustworthy. Runs allowed per 9 innings (RA9) for pitchers and batting average (BA) for hitters are routinely roasted for their limited value in assessing performance in smaller samples.
But that skepticism lessens as a player compiles a track record. After several seasons, you inevitably must concede that a particular player has been good, bad, or about average at hitting or pitching. Why? Intuitively, if someone keeps facing different competition and environments, it is reasonable to conclude that their results reflect actual skill (or the lack thereof). Mathematically, the more seasons a player piles up, the harder it is to budge their overall average results. The denominator has just grown too large. In this way, math complements intuition.
However, there is another path that borrows elements of math and intuition. That solution uses the language of uncertainty: in a smaller sample, particularly with a noisy statistic, we are extremely uncertain how much of that result reflects player contribution versus player circumstances. As the track record lengthens, we become more confident about that ratio, and our uncertainty narrows. By the time a player has wrapped a long career, we are quite confident about what the player has done, not just by counting plate appearances, but because we have virtually no doubt that we are dealing with a player of a certain level of accomplishment. In sum, the information we gain from all those seasons leads to only one reasonable conclusion, and we have no principled basis to see the player any other way, even with an otherwise noisy statistic like RA9 or batting average.
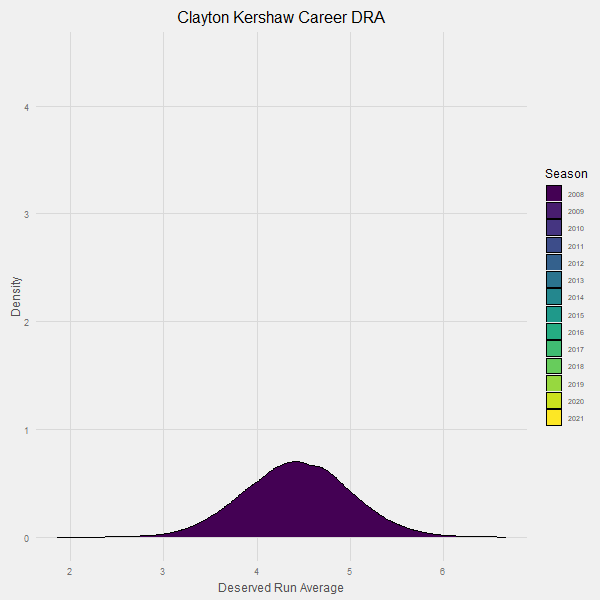
To illustrate, let’s consider two different ways of looking at the career to date of Clayton Kershaw, indisputably one of the greatest baseball pitchers of his generation. We’ll use Deserved Run Average (DRA) for this comparison, for reasons that will become clear. Remember that DRA is indexed to RA9, not ERA, so it will usually be a few tenths of a run higher per nine innings than ERA.
From 2008 to the present, Kershaw’s annual DRA values have been as follows:
| Season | DRA | DRA SD | IP |
| 2008 | 4.43 | 0.57 | 107.67 |
| 2009 | 3.49 | 0.43 | 171.00 |
| 2010 | 3.21 | 0.46 | 204.33 |
| 2011 | 3.06 | 0.27 | 233.33 |
| 2012 | 3.30 | 0.28 | 219.67 |
| 2013 | 2.86 | 0.29 | 236.33 |
| 2014 | 2.50 | 0.30 | 198.67 |
| 2015 | 2.51 | 0.26 | 229.33 |
| 2016 | 2.97 | 0.18 | 149.33 |
| 2017 | 3.37 | 0.43 | 171.33 |
| 2018 | 3.75 | 0.40 | 161.33 |
| 2019 | 4.24 | 0.38 | 177.33 |
| 2020 | 3.45 | 0.63 | 58.33 |
| 2021 | 3.10 | 0.56 | 94.33 |
One could summarize Kershaw’s career in two ways. The first is the traditional way: a weighted average of all his seasonal DRA values, with the weights being the innings pitched each season. An average of all these seasons, weighted by innings per season, will give you a career DRA of 3.23 over a career of more than 2400 innings pitched:
| Season | DRA | DRA SD | IP | Career DRA by IP |
| 2008 | 4.43 | 0.57 | 107.67 | 4.43 |
| 2009 | 3.49 | 0.43 | 171 | 3.85 |
| 2010 | 3.21 | 0.46 | 204.33 | 3.58 |
| 2011 | 3.06 | 0.27 | 233.33 | 3.41 |
| 2012 | 3.30 | 0.28 | 219.67 | 3.39 |
| 2013 | 2.86 | 0.29 | 236.33 | 3.28 |
| 2014 | 2.50 | 0.30 | 198.67 | 3.17 |
| 2015 | 2.51 | 0.26 | 229.33 | 3.07 |
| 2016 | 2.97 | 0.18 | 149.33 | 3.06 |
| 2017 | 3.37 | 0.43 | 171.33 | 3.09 |
| 2018 | 3.75 | 0.40 | 161.33 | 3.14 |
| 2019 | 4.24 | 0.38 | 177.33 | 3.23 |
| 2020 | 3.45 | 0.63 | 58.33 | 3.23 |
| 2021 | 3.10 | 0.56 | 94.33 | 3.23 |
This makes logical sense, but it is also somewhat arbitrary. To be sure, this weighted average is at least directionally correct: More innings pitched gives us more information about how good (or not good) a pitcher is, and as the innings pile up, once again our ability to change our opinion about the average career contribution of a pitcher becomes mathematically limited. But just because baseball decided to have something called “innings” and to average a career’s worth of innings to measure pitcher value, does not mean that we learn about a pitcher’s ability at the same rate a pitcher racks up innings. In fact we are almost certain that is not true, because a player’s contributions are influenced by other factors also, like their quality of opponents, their home parks, or changes to the league-wide run environment.
Let’s try something else. What if we summarized a player’s career based on the amount of information those innings gave us, rather than just assuming that volume of innings is the only thing that matters? In theory, we have gained information about Kershaw’s performance each year, and we can use Kershaw’s DRA and the approximate uncertainty around that DRA — the SD or standard deviation — to reach a hopefully more accurate conclusion in a less arbitrary way. As we combine more and more seasons, our uncertainty about Kershaw’s average performance should go down, not because of the exact number of innings he has thrown, but because of the specific amount of information drawn from those innings. As you will see, that is exactly what happens as the information gained over Kershaw’s career culminates in high certainty of his greatness, even as seasonal DRAs vary:
| Season | DRA | DRA SD | IP | Career DRA by IP | Career DRA by Information | Career DRA Uncertainty |
| 2008 | 4.43 | 0.57 | 107.67 | 4.43 | 4.43 | 0.57 |
| 2009 | 3.49 | 0.43 | 171.00 | 3.85 | 3.83 | 0.35 |
| 2010 | 3.21 | 0.46 | 204.33 | 3.58 | 3.61 | 0.28 |
| 2011 | 3.06 | 0.27 | 233.33 | 3.41 | 3.33 | 0.19 |
| 2012 | 3.30 | 0.28 | 219.67 | 3.39 | 3.32 | 0.16 |
| 2013 | 2.86 | 0.29 | 236.33 | 3.28 | 3.21 | 0.14 |
| 2014 | 2.50 | 0.30 | 198.67 | 3.17 | 3.09 | 0.13 |
| 2015 | 2.51 | 0.26 | 229.33 | 3.07 | 2.97 | 0.11 |
| 2016 | 2.97 | 0.18 | 149.33 | 3.06 | 2.97 | 0.10 |
| 2017 | 3.37 | 0.43 | 171.33 | 3.09 | 2.99 | 0.09 |
| 2018 | 3.75 | 0.40 | 161.33 | 3.14 | 3.03 | 0.09 |
| 2019 | 4.24 | 0.38 | 177.33 | 3.23 | 3.10 | 0.09 |
| 2020 | 3.45 | 0.63 | 58.33 | 3.23 | 3.10 | 0.09 |
| 2021 | 3.10 | 0.56 | 94.33 | 3.23 | 3.10 | 0.09 |
The two methods start off with the exact same information from the 2008 season, but over time, the traditional weighted average of Kershaw’s seasons by IP understates his greatness. By directly relying instead upon the information contained within DRA, we get not only a more accurate estimate of his performance, but also an uncertainty around that career performance, a perk that is not available from the traditional weighted average method.
Here is an animation that demonstrates our learning process over time:
Note how the uncertainty around Kershaw’s contributions continues to go down over time until it has converged in the probable range of 3.10 +/- .1 runs per 9 innings.
The beauty of information-based averaging is that it does not require a denominator to generate our weights. There is no need to worry about the number of innings Kershaw has pitched or batters Kershaw has faced in a given season because those inputs, to the extent they are relevant, are already incorporated in the uncertainty.
What we need instead is the midpoint value for the statistic over each season (or other time period) and the uncertainty around that midpoint. Employing this strategy means that the update process will end up being personal to each player: Volatile players with more uncertainty will produce noisier (and thus less trustworthy) career statistics, while those with less uncertainty will produce more precise midpoints that will leave less doubt as to their expected contributions.
Projections and Performance as Information
With this insight, let’s revisit our challenge of updating projections.
The reason it is hard to update projections, at least using traditional weighted average methods, is that projections don’t come with natural weights we can easily combine with season-to-date stats. Although projection systems may forecast playing time along with performance, the two values are only weakly linked. Many of the most effective pitchers on a rate basis toss fewer, not more innings. Top prospects get limited opportunities on a championship team while declining veterans get full seasons on a rebuilding club. Thus, if your plan for updating a preseason projection is to weight projected versus actual playing time, you are going to be disappointed with your results. The denominators are not measuring the same thing. The answer is wrong.
This is how, I suspect, we ended up with the prevailing method of gradually shifting more weight from the preseason projection to the season-to-date performance as time goes by. The idea is right. But it is also arbitrary, somewhat like using plate appearances or innings pitched for weighting career statistics: directionally correct in a broad sense, but not based on the actual amount of information gained over time, and certainly not updating information on a customized basis for each player.
Which is why if you subscribe to Baseball Prospectus, this is your lucky day. We provide PECOTA projections with uncertainty quantification. Our deserved and other modeled statistics are provided with uncertainty quantification also. As a result, our modeled statistics allow you to perform information-based updates that combine projections and season-to-date performance in an optimal way. In the meantime, we are already using these updates to provide the rest-of-season projections currently available to our fantasy subscribers in their applications, and to power our rest-of-season standings projections. So, if one of the reasons you subscribe is to get the benefit of these insights with no additional work for you, feel free to stop reading, open The Ax or Scoresheet Draft Aid, and get started.
Briefly, let’s look at a few of the hitter projections that have plunged the most:
| Name | PECOTA DRC+ | DRC+ so Far | DRC+ ROS |
| Yordan Alvarez | 138 | 106 | 121 |
| Cody Bellinger | 138 | 88 | 121 |
| Keston Hiura | 102 | 53 | 85 |
| Paul Goldschmidt | 135 | 104 | 119 |
| Franchy Cordero | 90 | 56 | 75 |
And here are some of the hitter projections that jumped the most:
| Name | PECOTA DRC+ | DRC+ so Far | DRC+ ROS |
| Cedric Mullins | 72 | 116 | 81 |
| Akil Baddoo | 68 | 98 | 75 |
| Jonathan India | 86 | 106 | 91 |
| Salvador Perez | 107 | 120 | 113 |
| Jacob Stallings | 71 | 101 | 76 |
Pitchers similarly have received updated rest-of-season projections, although theirs tend to be a bit more aggressive, especially on the high end, as we fit the distribution of run-scoring that we now expect, rather than center around an expected league mean, as we tend to do for projections. People formerly expected to be merely bad are now increasingly expected to be very bad. Moreover, for both hitters and pitchers, the values do not always come out somewhere between the projection and the season to date performance, particularly with composite statistics that have a number of internal moving parts that each themselves can reflect changes in the league run environment.
To end on a happy note, here are the pitchers who have shown the most improvement by expected, rest of season DRA:
| Name | PECOTA DRA | DRA so far | DRA ROS |
| Nick Sandlin | 5.01 | 3.16 | 3.77 |
| Michael Kopech | 5.08 | 3.20 | 4.06 |
| Corbin Burnes | 4.12 | 1.95 | 3.22 |
| Carlos Rodón | 5.10 | 3.01 | 4.37 |
| Robbie Ray | 5.11 | 3.68 | 4.42 |
You may recall that in our PECOTA season preview, we discussed that PECOTA had very wide uncertainty around the expected performance of Michael Kopech and very little uncertainty around the expected performance of Clayton Kershaw. As we approach the three-month mark, Kershaw is within the tight range we projected him to be, whereas Kopech, with his large amount of incoming uncertainty, is a classic candidate to have his season-to-date performance weight disproportionately toward his rest-of-season projection. As you can see, that is what seems to be happening. Information-based averaging is a good thing.
We hope you enjoy your updated projections. For the moment, only major-league performances are being incorporated into these rest-of-season updates. Incorporation of minor-league performances is likely as those leagues get deeper into their respective seasons.
For those interested in the methodology, we provide the appendix below.
Appendix: Performing Information-Based Updates
Some of you will want to know how to perform these updates for yourself, so you can leverage your own additional insights and generate the most optimized projections for players that interest you, both in baseball and other settings. Again, this requires you to either be using BP statistics or other statistics which also provide uncertainty intervals. For interested readers, we offer further detail.
The question answered by information-based updates is this: Conditional on one set of performance being true to some extent, what more do we learn by adding some new performance that is also true to some extent? Many readers will recognize this as a Bayesian update of prior information to include new information. Even though virtually all of the analyses and models I compose for this website are Bayesian, I rarely describe them that way. My fear is that the “B word” conjures up images of complex logical chains and intractable integrals. It can discourage rather than inspire readers.
Fortunately this need not be one of those times. We can take advantage of what are known as conjugate priors to combine our sources of information with arithmetic: no Markov chains or integrations are required (although they might do a slightly better job).
The approach is this: our statistics are based on exponential distributions, and thus their distributions are, if not perfectly normal (what is, these days?), they are at least normal-ish. If we assume that normal-ish is close enough, we take advantage of the fact that when you combine a normal distribution with another normal distribution you end up with . . . an updated normal distribution. No calculus required. As such, as long as your inputs are distributions rather than point estimates (again, this is why PECOTA and deserved statistics work for this, and most other baseball / sports statistics do not), you can calculate your update values in Excel, or R, or your phone’s calculator app, or by hand on paper.
To combine two normal distributions, and obtain your updated normal distribution, you need the average (location measure) and the precision (spread measure) for each distribution. (The precision is the reciprocal of the variance, which is a much more commonly used term to describe spread). So if you have the variance or more commonly the standard deviation (SD), which is the square root of the variance, you already have the precision available to you: you just need to convert it.
To obtain the midpoint of your updated distribution, you perform a weighted average of the two location measures, weighted by the precisions of the two distributions. Although you can perform a weighted average in virtually any computing environment, here is one way to compute the updated location for your new normal distribution in R, combining distribution (mean_1, sd_1) with distribution (mean_2, sd_2):
weighted.mean(c(mean_1, mean_2), c(1/sd_1^2), (1/sd_2^2))
To obtain the spread for your updated distribution, you sum the two precisions:
1/sqrt((1/sd_1^2) + (1/sd_2^2))
Intuitively, it may help to remember that adding the precisions of two values makes the updated distribution’s value more precise.
The updated distribution defined by your updated location and spread is your optimal, updated estimate of a player’s performance, whether that be a summary of career performance, an in-season update to a projection, or any other problem that presents itself similarly. Although we have combined only two distributions here for simplicity, you can in theory combine as many values as you want, either all at once or sequentially. Other approximation methods may do a serviceable job, but at least in theory, other approximations can do no better than what comes out of a Bayesian update.
One last note for PECOTA subscribers: this year, we have given you quantiles but not the SD for PECOTA, so you need to derive the SD. Here is how you would do that, working from the 20th and 80th quantiles of your distribution:
dist_sd = (dist_80 – dist_20) / 1.68
1.68 is your constant that reflects the difference between these two quantiles in a typical normal distribution.
Thank you for reading
This is a free article. If you enjoyed it, consider subscribing to Baseball Prospectus. Subscriptions support ongoing public baseball research and analysis in an increasingly proprietary environment.
Subscribe now
The only critique would be how you interpret guys that undergo major underlying changes that are not directly measured (i.e. new pitch, new swing, increased spin rate, that sort of stuff). In most cases those changes probably happen early in careers and this approach probably works very well to quickly adjust. Still, one would think there will always be a couple outliers that slip through the cracks.
Struggling to come up with a longer list of examples, but J.D. Martinez seems like the most dramatic one in recent times. Predicting whether that 2014 breakout was real or not midseason without an understanding of how he altered his swing probably doesn't work no matter what we do from a stats perspective.
Specifically, in PECOTA, if I'm not mistaken, the 0-99 distribution is based on DRC+ and then the larger statline for each player is derived from this number. This explains why a player may have more HRs in a lower quantile performance. So is it possible to update the entire statlines midseason in the manner you described above? Seems it may not work as the peripheral stats are not normally distributed in the same way DRC+ is? Apologies for all the questions.