In May, we introduced the Baseball Prospectus Injured List Ledger. (You can reach it via the Tools menu on your computer or mobile device.) It lists, by team, each player who’s been on the IL this year, as well as summary data like days and WARP missed by injured players. Today we’re adding another tool, the Recovery Dashboard. You can access it here.
When you first land on the page, you’ll see a list of every IL placement since the beginning of the 2016 season. It lists the player, date he went on the IL, type of injury, and total days missed. It’s a formidable list, and the best way to use it is to parse it for specific searches.
Starting at the top of the page, let’s say you’re interested in the sad litany of Mike Trout injuries. If you enter the best player in the game’s name in the Player box, you’ll see two IL placements—46 days in 2017 with a torn thumb ligament and 14 days in 2018 with an inflamed wrist. You won’t see his foot surgery in 2019 (since it occurred in September, the Angels didn’t bother putting him on the IL) nor his Calf Injury That Never Heals this year (because the dashboard lists only players who’ve, as the name implies, recovered by completing their IL stint).
You can also do searches for multiple players. Enter Aaron Judge and Giancarlo Stanton and you’ll see the pair of gigantic Yankees has had eight IL stints, covering 315 days, since 2019.
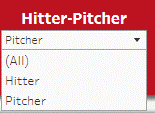
The dashboard allows you to do some complex searches. You can drill down on body parts. Say you’re looking for pitcher arm injuries in 2019 compared to 2021. First, select Pitcher from the Hitter-Pitcher dropdown.

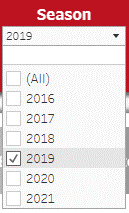
Then, select 2019 from the Season dropdown (by unselecting (All), the default, and clicking 2019).

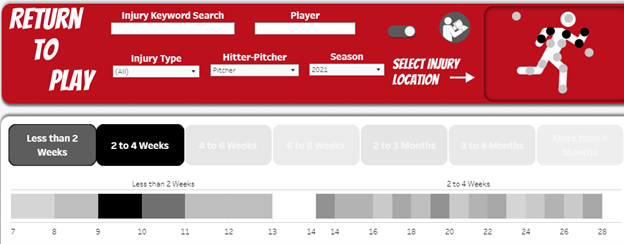
Then ctrl-click the shoulder, upper arm, elbow, lower arm, and hand injury locations on the stick figure.

You’ll see every pitcher who hit the IL, along with the typical number of days missed: mean of 57, median of 39. If you switch the season to 2021 (unselect 2019, select 2021) you’ll see the mean drops to 40 and median to 27, but again, that includes only players who’ve returned to play. Justin Verlander and Dustin May aren’t on the list.
One way to adjust for that prior to the end of the season is to look at just shorter-term injuries. If you move over the length-of-injury boxes (Less than 2 weeks, 2 to 4 weeks, etc.) or the Days Missed (1 to 189 overall) rectangles, you can see the number of players in each injury length bucket. Let’s limit our look at pitcher arm injuries to players who were out for no more than four weeks. Ctrl-click the Less than 2 Weeks (40 players) and 2 to 4 Weeks (58 players) boxes…

…you’ll see a mean of 16, median of 15 days missed. In 2019, the comparable figures are 34 for less than two weeks and 46 for two to four weeks—remember, that includes all players, since all injury list stints end at the end of the season—with a mean of 16 and a median of 14.
Earlier in the year, we wrote about the explosion of hamstring injuries in 2021. Entering hamstring in the Injury Keyword Search shows that there were 53 hamstring-related IL placements in 2016, 60 in 2017, 68 in 2018, dropping to 49 in 2019 but 96 already this year, and that doesn’t include nine players currently on the IL with hamstring injuries.
You’ll note that we skipped 2020, for obvious reasons. But 2020 does have one thing in common with this year. Type covid-19 in the Injury Keyword Search and you’ll see that in 2020, there were 98 players on the COVID-19 injured list (which, unlike other ILs, began at the start of summer camp), with a mean stay of 27 days and a median of 22. This year, despite outbreaks on several clubs, including some postseason contenders, we’ve had far more assignments (209 so far!) but with a mean of only five days missed, fewer IL days over a much longer season.
Let’s return to pitcher injuries for a moment. If you click on Pitcher, then Elbow on the stick figure, and select the 2019 season, there are 62 injuries. But you may notice some absent pitchers, like Chad Kuhl, Jonny Cueto, Taijuan Walker, and Michael Kopech. All of them missed all or most of the year recovering from Tommy John surgery. We didn’t include Tommy John surgeries in the default injury list because they inflate the days missed figures considerably. If you want to see them, just flip the switch at the top of the dashboard from right to left.

That’s the Tommy John Surgery switch. The color will change from white to red, indicating that you’re including Tommy John surgery-related IL stays. In 2019, that inflates the number of elbow injuries from 62 to 90 and days missed from a mean of 71 and a median of 56 to a mean of 99 and a median of 94.
You can use this tool to answer all sorts of injury questions. What’s the most common body part injured by hitters? This year it’s the upper leg, home of that pesky hamstring, of course. How many players have gone on the IL with blisters? Five pitchers in 2016 (Rich Hill twice), eight in 2017 (Hill twice, Aaron Sanchez three times), eleven in 2018 (Matt Bowman twice), six in 2019, three in 2020 (Walker Buehler twice), eight so far in 2021 (Andrew Miller twice with foot blisters). What was the worst year for fractures? In our survey, it was 2016, with 45, edging out 2018, with 41. What’s the costliest foot injury? Charlie Tilson in 2017 (right foot stress reaction), Troy Tulowitzki in 2018 (bilateral heel spurs), and Yoenis Céspedes in 2019 (heel surgery) missed entire seasons. Shortest non-COVID IL stay this year? Leury García, two days in concussion protocol.
Finally, you can access a User Guide via the icon to the right of the Tommy John Surgery switch.
We’re pleased to add this tool to our injury visualizations. We hope you find it as fun and informative as we do.
Thank you for reading
This is a free article. If you enjoyed it, consider subscribing to Baseball Prospectus. Subscriptions support ongoing public baseball research and analysis in an increasingly proprietary environment.
Subscribe now