Umpires are under the spotlight more than ever in the modern game. The growing understanding of catcher framing has instilled an instinctual knowledge of those being framed against. But more vitally, ball tracking technology and on-screen K-Zones give fans instant, objective, feedback when calls go against their team.
The popular twitter account and website UmpScorecards is a neat extension to this, combining all of an umpire’s calls to provide an overall accuracy score per game, along with the total run value of missed calls in favor of each team. These scorecards often go viral when an umpire has a particularly bad game or when the run value of missed calls is heavily weighted towards one team. Irate fans will use this as evidence that the umpire was clearly biased against their team and shouldn’t be calling major league games. But what if I told you that an umpire’s performance on their scorecard is more a function of the game state itself than the umpire’s innate ability to call balls and strikes?
I’ll be using the framework introduced by UmpScorecards along with a model of how umpires call balls and strikes to investigate which games are the hardest to call correctly and what makes them so difficult.
Dodgers at Giants, September 5
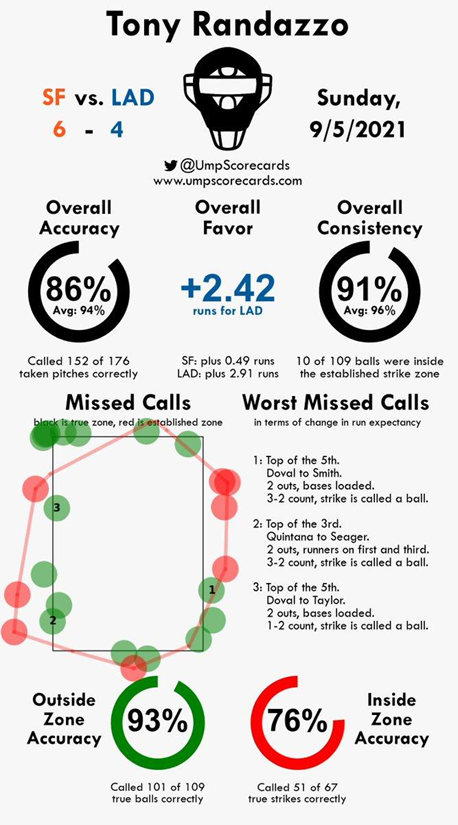
The game which spurred me to begin this investigation was the final regular season contest between the Dodgers and the Giants. The scorecard for this game was one of the worst ones I’ve seen, 2.42 runs in favor of the Dodgers from the umpire’s missed calls, with the chart showing a bevy of missed calls inside and outside the strike zone in all directions.
Source: umpscorecards.com
Having watched the game live, it was difficult to remember any particularly outrageous calls; many of the misses were on borderline pitches which most umpires would struggle to call correctly anyway. In addition, there were multiple tough calls in deep counts with the bases loaded, the most high-leverage game states possible. This got me thinking about how to make a measure of which games are most difficult to call which could contextualise scorecards such as this.
Measuring Called Strike Probability
Before measuring the difficulty of calling balls and strikes across a full game, we have to model the difficulty of calling balls and strikes for individual pitches.
I created a knn model to find the expected called strike probability for pitches based on their position as they cross the plate. This model takes the nearest 50 pitches to each pitch, and then the predicted called strike rate is a smoothed average of the called strike rate across all those nearby pitches. Other approaches to model called strike rates include a GAM approach used by Jim Albert here, and by this very website. The graph below shows the 5-15%, 45-55% and 85-95% contours for called strike probability, along with the strike zone as defined in the rulebook.
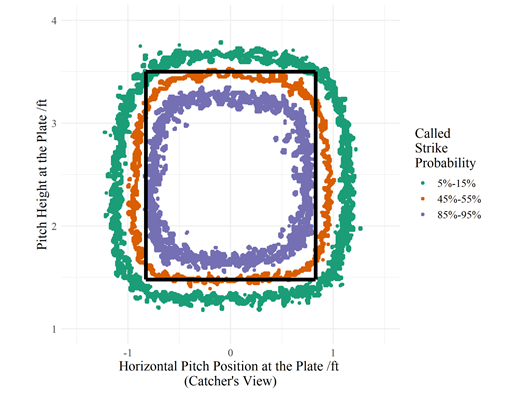
The graph shows the strike zone for an average player, but I adjusted based on batter height in the model itself. There are possible further adjustments based on count and batter handedness which I didn’t include to keep the model simple.
An umpire’s average strike zone is not the same shape as the rulebook zone. The umpire is more likely to call pitches off the plate at a low height than they are to call high pitches which lie just within the corners of the strike zone.
Using this model I can now simulate games with an imaginary umpire of average ability, statistically generating called strikes and balls on the pitches which weren’t swung at in each game. These simulated games can then give me a baseline for performance, telling me which games the average umpire called the least accurately and which games were likely to be biased in favor of one team over another.
I calculate run favor using the same method as Umpscorecards. There are 288 unique combinations of balls, strikes and base occupancy, each with an associated run expectancy. An umpire’s incorrect call changes the game state relative to a correct call and the run value is the difference between those two run expectancies.
I simulated every game of the season 100 times, collecting the simulated fraction of correct calls along with the distribution of run favor for missed calls. I wasn’t able to exactly recreate the same results as UmpScorecards because there are various assumptions to be made about the exact size of the ball, and how to deal with pitches within the measurement error of HawkEye, but the results are close enough and from here on I’ll be using my calculated values instead of UmpScorecards’ for consistency.
Which Games are most difficult for umpires?
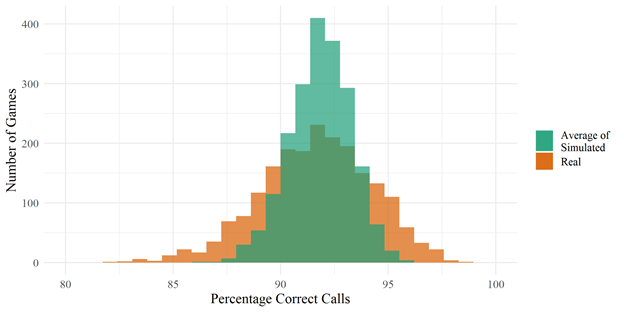
The graphs below show the distributions of correct call% in real games and on average for my simulated games. Real umpires show greater variance than the average result of my simulated umpires. We can see that different games can have significantly different predicted correct call%. The spread is from 86% to 96% so there could be three times the missed calls in one game over another, just from the distribution of pitches thrown, ignoring the umpire’s quality.
Where does the aforementioned Dodgers/Giants game appear in this distribution?
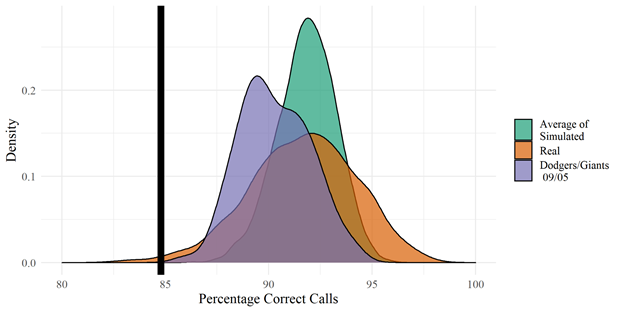
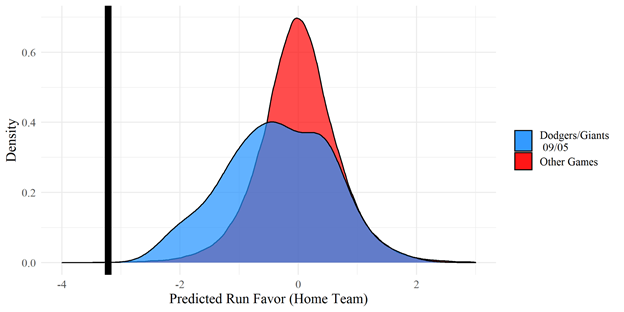
This game had a lower-than-average expected accuracy rate, meaning that there were lots of borderline pitches, but even with that caveat Tony Randazzo’s performance (shown by the black line) was markedly poor. In addition when looking at the simulated run favor there is a large tail in favor of the away team. This means that based on the pitches thrown, the average umpire would have missed more calls in favor of the Dodgers without any bias!
Looking in more detail
To look at the games in more detail I can plot an umpire’s “path” through a game along with 1000 simulated umpires to see which pitches the umpire’s run favor came from along with how my simulated umpires performed.
Below you can see how Tony Randazzo performed in the Dodgers/Giants game on 09/05. The solid black line shows the run favor in the real game, the dashed black line shows the run favor for the average simulated umpire, and the yellow to red shaded regions show the density of paths for 1000 simulated umpires. We can see that the overall run favor comes mainly from two missed calls, in the top of the third inning and the top of the fifth innings. The simulated umpires also struggled with the fifth inning, the spread in simulated run favor becomes much wider after those calls, suggesting that there were high leverage, difficult calls to make.
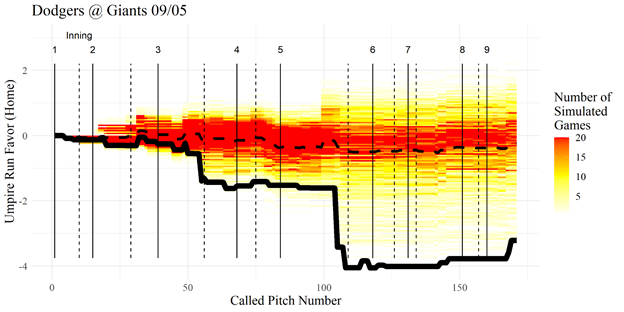
The call in the third inning was a pitch in the zone called a ball in a 3-2 count with men on first and third and two outs which had a called strike probability of 88%. This swung the run value by 0.83 in favor of the Dodgers. The fifth inning call was in an even higher leverage spot, the bases were loaded with two outs and again a 3-2 strike was called a ball. This time the called strike probability was 78% and the swing in run favor was a massive 1.81, this is the highest run favor possible on a single pitch.
There are games which were more difficult to call fairly than this game. The dramatic Yankees-Astros matchup on 07/11 was a very difficult game when it came to borderline calls. The umpire favored the Astros by two runs, but so did almost every one of my simulated umpires, up to four runs in extreme cases.

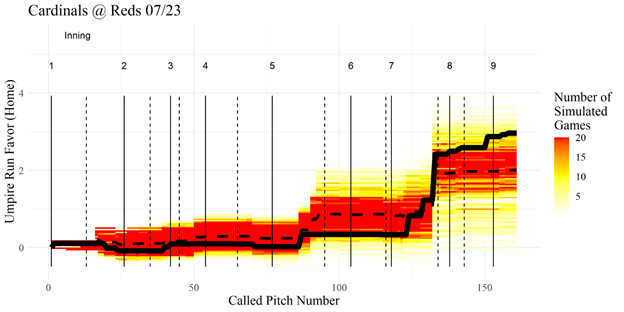
Similarly, in a game between the Cardinals and Reds my simulated umpires mirrored the real umpire in favoring the Reds by over two runs.
Should this change how we evaluate umpires?
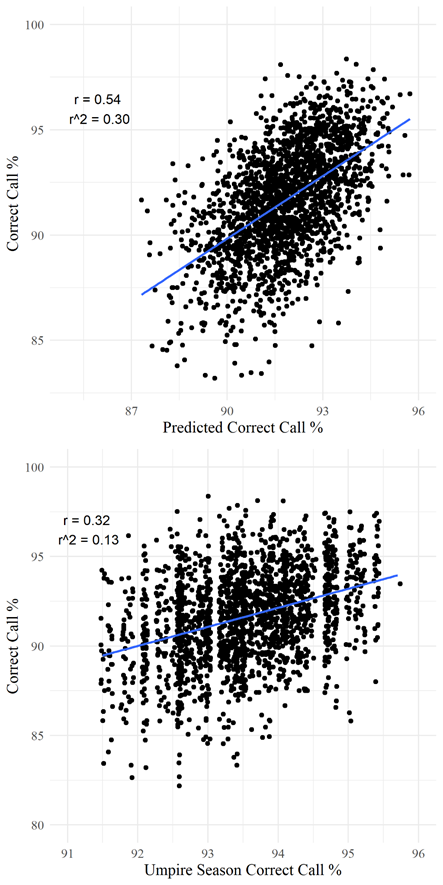
We don’t judge players on single game samples, and we should follow the same logic when evaluating umpire ability. The call accuracy for an umpire in a single game is better predicted using the expected accuracy for an average umpire, than by using the actual umpire’s overall accuracy on the season. This means that on a single game sample size, the game matters more for call accuracy than the umpire’s skill.
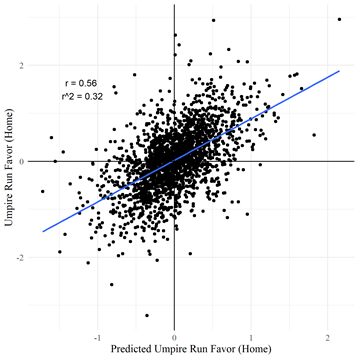
The predicted umpire run favor can also explain a lot of the variation in the actual run favor for a particular game. Interestingly the line of best fit in the graph below has a slope of less than one. This could be because make up calls by umpires reduce the overall run favor relative to my model’s expectation, as borderline calls are less likely to always be called in favor of the same team.
As with players, the variation tends to even out over larger samples of games. So we can learn about an umpire’s accuracy across the season even if individual games don’t tell us much.
Differences by Team
Do any teams throw pitches in locations where they are more likely to be screwed over by the umps or vice versa? This could have implications if an automated ball/strike system is introduced which go beyond catcher framing.
Top teams in exploiting the umpire zone over the rulebook zone:
| Team | Predicted Called Strike % | Zone% (Rulebook) | Difference |
| Rangers | 31.8% | 29.2% | 2.6% |
| Cardinals | 32.6% | 30.1% | 2.5% |
| Nationals | 33.3% | 30.8% | 2.5% |
| Diamondbacks | 33.6% | 31.2% | 2.4% |
| Cubs | 33.2% | 30.8% | 2.4% |
Bottom teams in exploiting the umpire zone over the rulebook zone:
| Team | Predicted Called Strike % | Zone% (Rulebook) | Difference |
| Rays | 33.8% | 32.2% | 1.6% |
| Twins | 31.9% | 30.3% | 1.6% |
| Pirates | 32.4% | 30.9% | 1.5% |
| Marlins | 33.6% | 32.2% | 1.4% |
| Yankees | 32.6% | 31.2% | 1.4% |
These differences between teams are small enough to be consistent with noise so it seems that catcher framing is the only way that teams can reliably get strikes outside the rulebook strike zone.
If MLB moves to using the rulebook strike zone with Robo-umps, then we can expect pitchers to be squeezed slightly more than they are currently, but no teams will lose a significant advantage based on where their pitchers throw the ball.
So what have we learned from this exercise?
It seems self-evident that some games are harder to umpire than others, but with pitch tracking data we can now put numbers to that theory. I’ve used a model of how umpires call balls and strikes to simulate games hundreds of times and create distributions of call accuracy and run favor. I can use these distributions to understand how bad an umpire’s game was relative to expectations of how the average umpire would perform.
The distribution of pitches in a game has more impact on ball and called strike accuracy than the umpire’s innate ability to call balls and strikes. In addition, the umpire bias in favor of one team or another can be partially explained by the pitches thrown in the game.
So the next time that you see a bad umpire scorecard, remember that even the best umpires are at the mercy of game conditions. Calling balls and strikes accurately is really hard, and just a couple of borderline high leverage misses can massively skew the perception of an umpire’s game.
Thank you for reading
This is a free article. If you enjoyed it, consider subscribing to Baseball Prospectus. Subscriptions support ongoing public baseball research and analysis in an increasingly proprietary environment.
Subscribe now