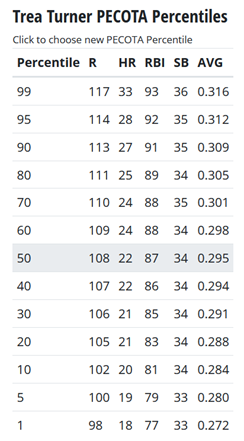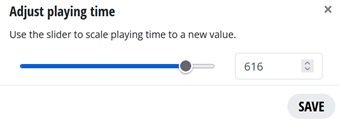
The AX offers new adjustability on two major settings so that you can customize valuations to reflect your own specific outlook for the coming season. By default, The AX (see original intro article here) generates values using each player’s 50th percentile PECOTA projection, and playing time estimates from BP’s Depth Charts. Both of these can be adjusted within the AX interface, allowing you to select custom performance or playing time estimates for as many players as you like, and the AX will automatically adjust the universe of values to reflect these adjustments. The performance selector allows you to apply any of 13 projection levels generated by PECOTA, while the playing time selector applies a linear adjustment to re-calculate counting stats for the specified amount of playing time (PA for hitters or IP for pitchers).

The editable categories are “%” for the percentile projection, “PA” for batter playing time and “IP” for pitcher playing time. By clicking into the blue, linked number you will be presented with the ability to select a given projection, or a slider for PA/IP respectively:


We’re targeting future enhancements to help you assess and manage the cumulative impact of many playing time adjustments, but for now it’s important to remember to keep the total budgeted playing time relatively consistent across all players. We hope you enjoy the new functionality provided by the adjustable playing time sliders in The Ax, as we work to develop additional features.
Thank you for reading
This is a free article. If you enjoyed it, consider subscribing to Baseball Prospectus. Subscriptions support ongoing public baseball research and analysis in an increasingly proprietary environment.
Subscribe now
so i've entered my league's settings, and the results are...bizarre. basically, most relievers, good and bad, are super, super high. they occupy the top 25-30 pitching spots. meanwhile, gerrit cole's like the 50th pitcher in the ranks.
now, i do have sv+hd instead of sv and ip as an additional category in my league, but i'm not seeing how these results make sense? would it be possible to talk to someone about this? i've tripled-checked the settings.
hitting seems fine, though.
Can you explain what this means on a practical level? Does this mean that if I drastically change a playing time estimate, I should increase the playing time of that player's backup?
Also, have you given any thought to allowing specific positions to be de-emphasized? Using my league settings (single catcher, OPS instead of AVG), prices for the best catchers are well over $30 - and with inflation, go much higher once keepers are entered. While these figures may be true due to the lack of depth at the position, but there is also no way anyone in my league is going to pay above mid-$20s for catchers. I'd love to be able to shift those prices down 30-40% across the board without radically changing their percentiles or playing time.
Re: the de-emphasizing, the answer right now is that the tool takes that scarcity into account and we'd argue is telling you something about catcher value. One possible approach to get the result you want would be to put the elite ones in as keepers at the price you think they'll go for, which will redistribute the money to other places. This could move the "problem" down to lower-tier catchers, but it is worth a look.
As for the catcher issue, I agree that it's telling me quite a bit about the catcher position. It's just jarring to see Salvador Perez at $50+ (after keepers) when I know he's not likely to get more than $25 - and I don't particularly want to be the high bidder even then (but maybe I should!).