Another year, another weird season for injuries. The 2020 season was weird because, well, you know. The 2021 season was weird because it came on the heels of the weird 2020 season. And this season—just when you thought it was safe to go back in the water!—we had the lockout, resulting in an abbreviated spring training and a delayed start to the season. Add some unseasonably cold weather in the northeast and upper midwest, plus some lockout-fueled scheduling quirks—the A’s played five games in Detroit last week with Oakland the home team Tuesday night, and the next day they played a doubleheader—and fluctuating roster sizes (28 to start the season, 26 now), and you’ve got a recipe for some strange outcomes that may not be directly comparable to prior seasons.
But we’ll try.
Have we solved hamstrings? Upper leg injuries, particularly hamstrings, piled up in 2021. Through 38 days this season, they’re more under control. This visualization, which we will add to the Injured List Ledger, counts the number of injured list stints (occurrences), by body part and season, for the season to date (for purposes of this report, 38 days). The gray bars represent the five-year average plus or minus one standard deviation. As you can see, upper leg injuries, mostly hamstrings, were far higher than normal last season (the orange dot on the last line) but they’re below average this year (blue dot on the last line). Other injuries, like back and several arm injuries, are higher than average:
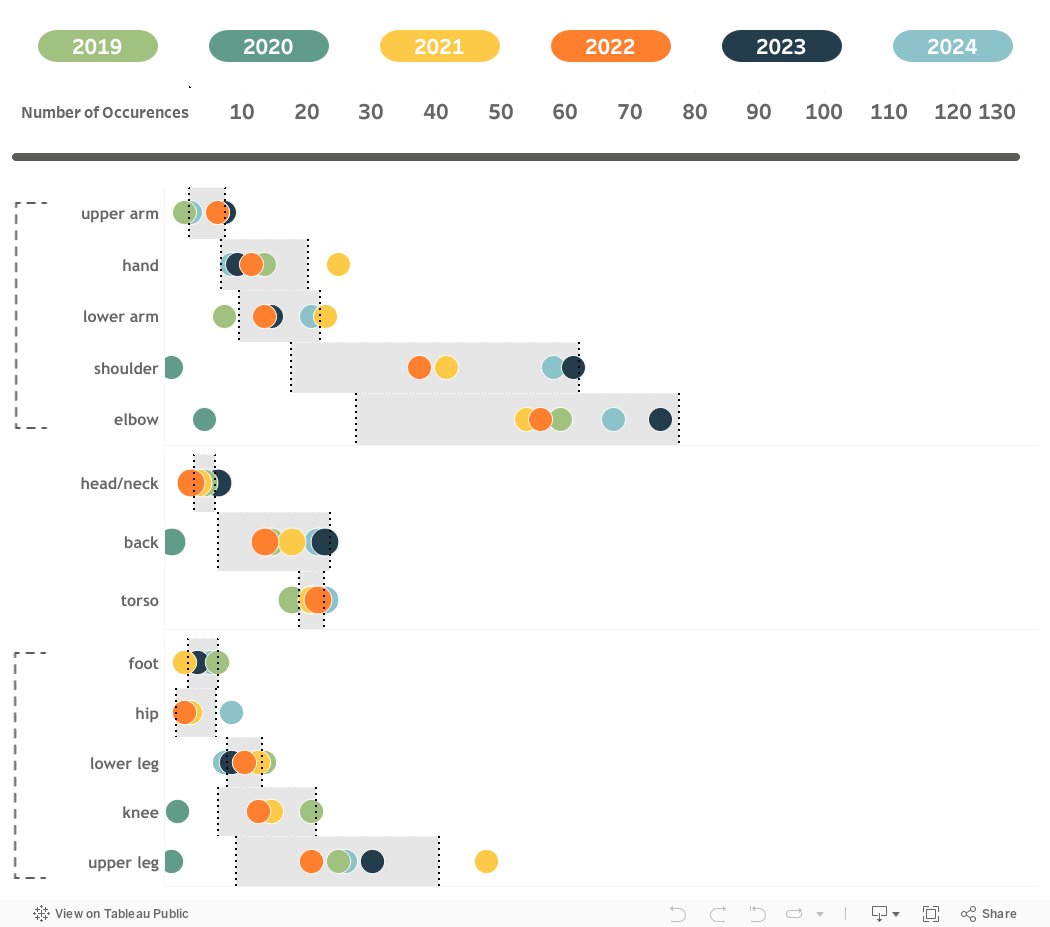
As for hamstrings, it’s too early to declare victory, but not too early to declare partial success.
Actually, are we solving everything?
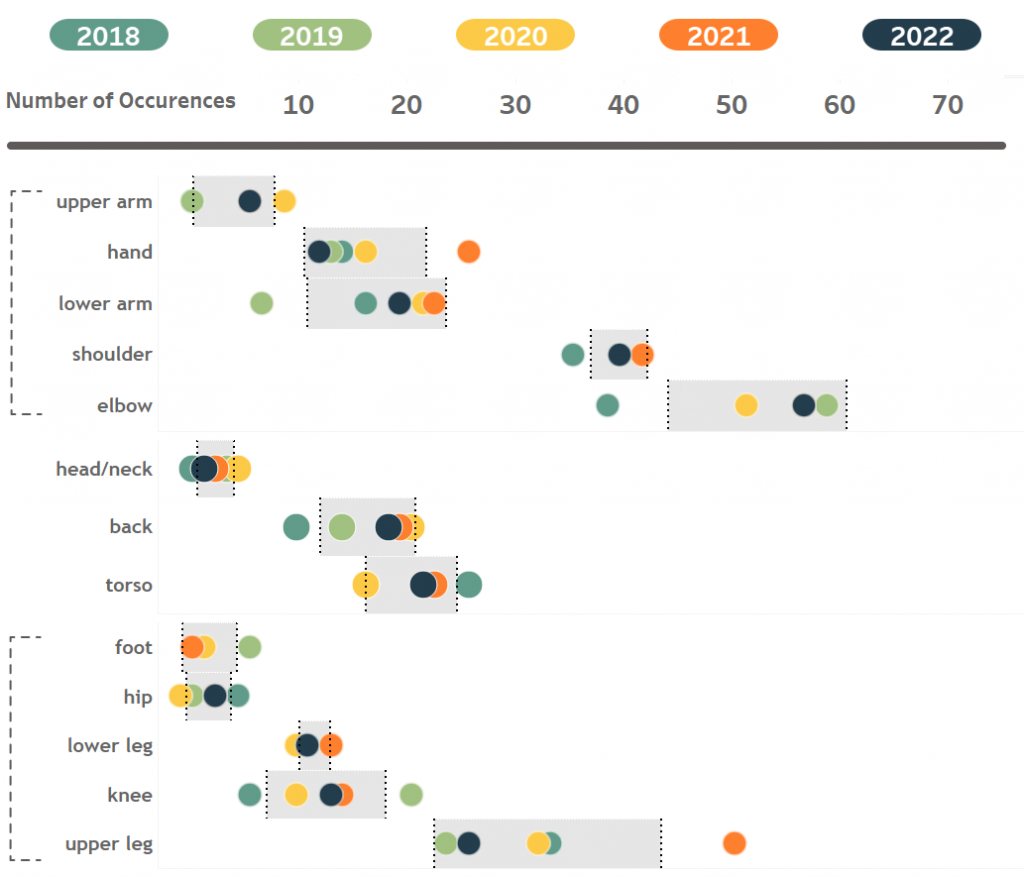
Here are days and games missed by players on the injured list, graphically:
That may not look encouraging—both games and days missed up compared to 2021—but it really is. This table lists total injuries through the first 38 days of the season:
| Season | IL Placements | Games Lost | Avg Games Lost/Injury | Days Lost | WARP Lost |
| 2018 | 218 | 3,963 | 18.18 | 4,822 | 15.4 |
| 2019 | 233 | 4,541 | 19.49 | 5,754 | 22.7 |
| 2020 | 292 | 4,747 | 16.26 | 6,485 | 6.3 |
| 2021 | 283 | 5,119 | 18.09 | 6,071 | 23.8 |
| 2022 | 246 | 5,351 | 20.14 | 5,604 | 17.2 |
Focus on the second column, the number of players placed on the injured list. The increased number of games lost this season despite fewer injuries than in the prior two years is partly an artifact of COVID-19 postponements in 2020-21, and an increase in doubleheaders this year to make up for the first lost week of the season. That’s affected the number of games lost per injury, as well. There was an average of almost one fewer game played per day over the first 38 days of 2021 than 2022. As you can see, the number of days lost to injury tracks well to the number of injuries.
That said, we’re still well above the injured list levels pre-COVID-19, so it’s not like we’ve had an outbreak of good health.
Are hitters getting healthier? Or pitchers less so?
There are several reasons why pitchers increasingly wind up on the injured list more than hitters. One is that pitching staffs continue to grow—there were teams carrying 16 in April, and now that the roster limit’s 26, there are still teams with 14—so there are more people to get hurt. But the main reason is, of course, that they’re pitchers.
| Season | % of injured players that are pitchers |
| 2018 | 56.0% |
| 2019 | 58.4% |
| 2020 | 62.3% |
| 2021 | 61.0% |
| 2020 | 65.9% |
All figures exclude COVID-19 IL stints. That slight downward blip in 2021? Definitely a head fake, it appears. Pitchers are getting hurt at almost twice the rate of hitters so far this year. Through Saturday, the Red Sox, Dodgers, Mets, Cardinals, and Rays had combined for two hitters on the IL, and 34 injured pitchers.
The most snakebit team. You can find this by looking at the Injured List Tracker, but we’ll spare you the click. Through Saturday, one team stands out. They currently lead the majors with 14 players on the IL. Players on its injured list have missed 443 games, the most in the majors. That equates to 443 calendar days, also the most in the majors. Those injured players represent 2.3 WARP, the most in the majors. That, in turn, represents 8.4 percent of their preseason WARP, also the… you get the picture.
The Jiménez-and-Lynn-less White Sox? The Tatis-and-Snell-less Padres? Nope, it’s your 9-26 Cincinnati Reds. Granted, they’ve been bad. But they would have been less bad had they not missed, among others, 38 days of Donovan Solano (hamstring), Jose Barrero (hamate bone), and Mike Minor (shoulder); 21 days of Justin Wilson (elbow); 25 days of Jonathan India (hamstring, twice); and 12 days of Joey Votto (COVID-19). And that WARP figure is based on preseason WARP, so it doesn’t include players like Tejay Antone, likely out for the year following Tommy John surgery last summer, since we didn’t assume any wins from him. The Reds weren’t expected to be good, no, but health hasn’t helped them counter those expectations, either.
We’ll continue to track injuries over the course of the season. And you can check out the IL Ledger for daily updates.
Thank you for reading
This is a free article. If you enjoyed it, consider subscribing to Baseball Prospectus. Subscriptions support ongoing public baseball research and analysis in an increasingly proprietary environment.
Subscribe now