Batting average used to describe the game of baseball a lot more accurately. There’s still something of a quiet brilliance to it, because we can see in it the recognition, even early on in the game’s history, that while the measure of a team at bat is how many runs they score, the most important measure of a batter can be reduced to out/not out. Outs are the fundamental unit of baseball. If you make one, you not only erase yourself, but you come closer to also erasing whatever good your teammates may have done before you.
But batting average has a few obvious flaws. Some of its quirks make sense in historical context. The measure treats a single the same as a home run, lumping them all together as “base hits.” In 1871, the first recorded year of “major” league baseball, 77 percent of all hits were singles. In 2022, it was 65 percent, and hits in general were far more common during the Ulysses S. Grant administration. “What type of hit did you get?” used to be a less relevant question. It was much more likely to be a single. But even with that, batting average still makes sense if you just think of it as “How often did the batter do something positive?”
The bigger problem that batting average has is that it pretends that walks never happened. In the 1870s, that actually made sense. The game had some very different rules at the time. For one, the walk rule required either 8 or 9, depending on the league, “unfair balls” before you got first base for free. The act of pitching was also very different. “Pitching” is an under-handed motion. It’s the one you use when you play cornhole. We now associate the word with throwing, but the pitcher was mostly there to serve the ball up for the batter to hit so that the “bases” part of baseball could begin. If the pitcher missed 8 or 9 times, it was clearly the pitcher’s fault and you probably didn’t deserve credit.
But the game was in flux. Raising the arm above the waist was officially prohibited at first, but there was a strikeout rule, and pitchers learned that by adding spin and changing speeds, they could affect the batted ball and maybe get a few K’s. A few dared to raise their hands and that too was legalized. Now, batters had to not only hit the ball, but contend with pitchers who were trying to fool them into swinging at balls that looked nice, but were eventually unfair. The walk rule was eventually shortened to four balls and being able to tell when the pitcher was being sneaky became a skill. It might get you first base.
Batting average had started with the assumption that walks were of no credit to the batter, but when the game evolved, it didn’t change that assumption. Well, until 1887. In 1887, walks counted on the positive side of batting average for one year. And then they put it back. Something about how the new rule made players chase walks and that slowed the game down.
And then batting average got stuck there in the 19th century. At one point, it described the game well, but by the time Brad Pitt became general manager of the A’s, walks were a part of the game, and ignoring them made no sense.
All measures have assumptions baked into them, some intentionally, some not. If the assumptions accurately reflect reality, then that’s great, but the thing about assumptions is that sometimes, reality changes around them and it ends up making things difficult for you and me. I’m pretty sure that’s how the saying goes.
Is the tale of batting average a cautionary one? What happens when reality starts to drift away from the assumptions of a measure? There are a number of places that WAR can trace its roots. Some of the ideas have been around for decades, but the math undergirding the ideas was laid down in the 1990s. To look back on some of it, we see some assumptions that were true in the 1990s. But are some of them becoming outdated?
Warning! Gory Mathematical Details Ahead!
WAR is thankfully much better at capturing a fuller spectrum of value than some of the well-known older statistics, and it’s very good at putting everything on the same scale. How many singles is a double or a double play turned worth? The strength of WAR has been tying together most of the strands in the game. There are places where we have reason to believe that it is lacking. We still have no way to incorporate value around team chemistry or clubhouse influence. We’re pretty sure that catchers play a bigger role than we give them credit for, both as game callers and also emotional support giraffes for the pitcher.
But even WAR has assumptions baked into it that need to be examined. One of the strengths of WAR was that it included the fact that position matters in understanding baseball value. A first baseman who hits like an average first baseman is an average player. A shortstop who hits like an average first baseman is an all-star. In the 1990s, though, we thought about positions a little differently.
At the time, the predominant model for roster management was the starter-backup model. It’s still around and common, but there’s a new contender in town. In the starter-backup model, a team has a regular starter assigned to each position. If the starter is injured or needs a day off, a team has a utility player or players who provide backup. The idea of replacement players came from the thought that there was a pool of talent that was waiting behind the starters and that pool should be the baseline. The idea that we needed positional adjustments came, in part, from the fact that it’s harder to find someone who can handle shortstop than it is someone who can handle first.
The only other model that had caught on was the platoon model, in which you took two flawed players who played the same position and they effectively deputized for each other. Since the 1990s, we’ve seen the emergence of something else that I call the spectrum model. The idea is this: Smith is our shortstop and needs a day off. In the starter-backup model, Smith’s replacement would be the utility infielder playing short. Sometimes that happens, but sometimes, we see something else. Clearly, someone else will have to enter the lineup, but what if Jones, the regular third baseman, shifts over to play short and the backup corner infielder comes into the lineup.
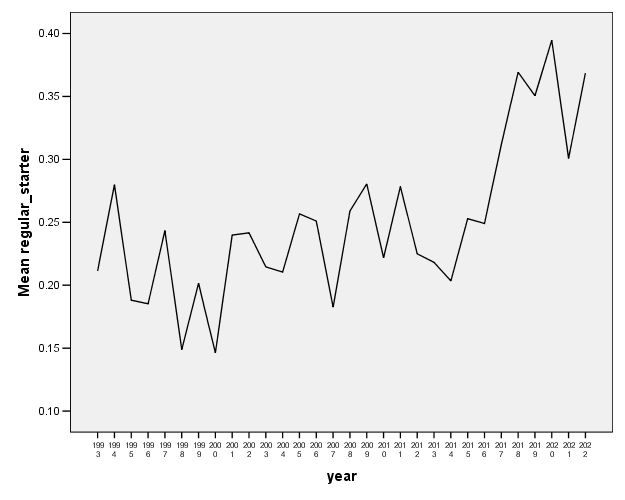
Here’s a graph, showing 1993-2022, of how often those sorts of “sliders” happen. A player who is the regular starter at a position (more than 81 games there for the team) takes exactly one game off. How often is that player’s replacement at the defensive position a regular starter from another position?

There’s been a spike in these “sliders” and one that wasn’t around when the base ideas for WAR were being laid down.
Jones may play third most of the time but can play short when needed. And relieved of the need to keep a dedicated bench shortstop around, the team can sign a reserve player who hits like a (bench) corner infielder. It not only means that they lose a little less on Smith’s days off, but they also have a bench bat for pinch hitting situations who’s better.
Because Jones can handle a spectrum of positions and is able to slide back and forth, that extra ability enables the team to carry a better replacement. WAR wasn’t built to express that. We don’t have a way of crediting Jones for that extra glove. In fact, the measure sees Jones (and adjusts accordingly) based on Jones’s 140 games at third. In the old accounting, you played third because you were a third baseman. What happens when positions get a little more slippery?
The idea of the replacement pool also came about in the context of a shallower talent pool. MLB has seen an influx of players from other countries, as MLB has made strategic investments in both opening up new areas of fandom and new pipelines of talent. In the 1990s, about 15 percent of MLB players were born outside the US. It’s now almost double that. The population of the United States has grown since the 1990s and the number of kids in other countries picking up a bat and ball has increased as well, but the number of roster spots hasn’t grown quite as fast. It means that the ratio of talented players to roster spots is becoming more squeezed.
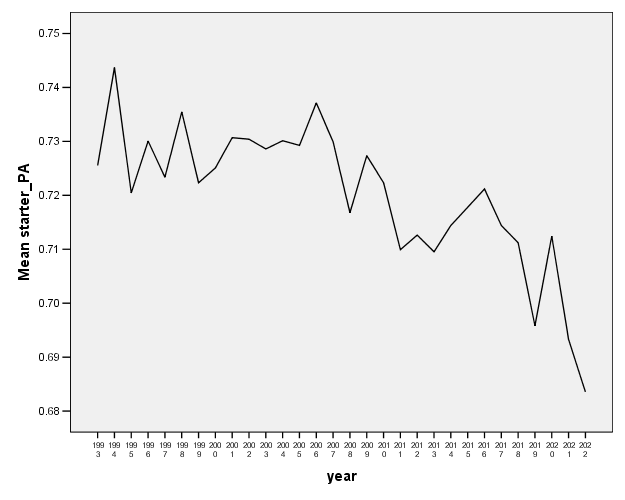
The superstars will separate themselves, but what happens when there are benchwarmers who are creeping up in talent on the eighth and ninth best hitters in the lineup. You can start to justify more switcheroos and more days off. And that’s what’s happened. Below, we have a graph of the percentage of plate appearances taken in each season by the “starters” in the league. Starters are defined as the players from 1st through 8 times the number of teams in the league in the number of plate appearances taken. (In 2022, there were 30 teams, so 1 through 240. In 1993, there were only 28 teams, so 1 through 224.)

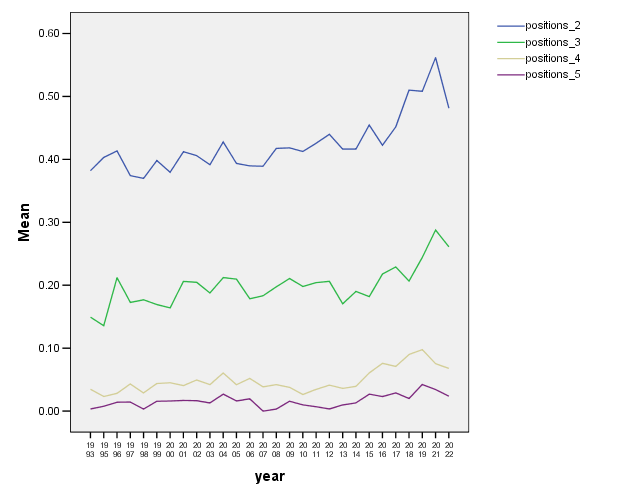
We can see that starters are sliding out of the lineup more often than they once did. And with multi-positionality being “a thing” now… well, here are the percentages among players who played at least 81 games (shortened seasons in 1994, and 2020 were removed) that played at least five games at two or more defensive positions. And then we have a line for three or more and then four or more and then five or more.

Players carry more gloves than ever in their lockers, and there’s an obvious inflection point on those graphs in the last decade or so.
It means that WAR has another problem that it needs to address. WAR has a stated mission of evaluating a player without crediting (or debiting) the player for what their teammates did (or didn’t do). Above, we saw Jones who was capable of handling shortstop and played it sometimes, but normally played at third. Culturally, in the 1990s, we would have said that Jones is a third baseman (and that’s what WAR sees), but Jones is a third baseman only by circumstance. We can side-step this by saying that WAR can only evaluate what Jones did on the field, rather than what might have otherwise been, but it seems like a place where we could do better.
This isn’t the only place where WAR, and the people who love it, are starting to show their ages. We’ll talk about a few other spots where the paint is peeling in a later article, but we do need to be careful not to get complacent. The nice thing about WAR is that it’s a framework that can change. As we discover new things about the game or gain new data sources or come up with better ways to model the game, the formula can (and should) change. WAR doesn’t have to travel the cautionary path of batting average slouching from a good descriptor to fuel for a market inefficiency because it lost its connection to the game. But it means being willing to understand that WAR has its own cultural assumptions baked into it and being willing to both challenge those and work with those honestly.
If we don’t, then WAR gets stuck in the 20th century. And some day, Brad Pitt will find the weak spot in WAR and use it to have a few winning seasons in Oakland, and we’ll all look kinda silly for swearing that it’s the best measure ever.
Thank you for reading
This is a free article. If you enjoyed it, consider subscribing to Baseball Prospectus. Subscriptions support ongoing public baseball research and analysis in an increasingly proprietary environment.
Subscribe now
The biggest flaw of WAR (and the issue youve identified here is part of it) is that there is an assumption that talent is equal at all positions. Realistically, youll see more or less talent at certain positions in certain seasons (most obviously there has been less talent at 2B for basically all of baseball history).
The biggest issue of all on the “sliding players” point is DH. Elite batters get “off days” from the field and DH, and you see someone like Harper who could improve his teams defense, but the team wont risk injury. This causes the model to raise replacement level, and its the reason why Ohtani’s batting WAR was so comically low that the religious WAR followers thought judge actually deserved the MVP.
WAR by contrast doesn't even tell you if the player is a hitter, a pitcher or both. Now today we don't really need to be descriptive because we can all watch every play if we want. But when accuracy just reduces everything to a fog, it really has little value. As with BA, WAR is most interesting when it is very high or very low. But where WAR tells us nothing (or everything) itself about the player, BA just tells us about one aspect of the player. In the end they are both just numbers, meaningless without context.