In BP articles past, there’s been a lot of discussion over how to quantify a hit tool. In 2018, Matthew Trueblood took a stab at a hit tool indicator using fouls+whiffs per swing. Kevin Carter proposed an alternative to basing hit tool evaluation off projected batting average, by instead basing hit tool on a player’s ability to consistently make hard contact, and then to focus on the individual skills behind the curtain of the enigmatic “hit” tool. To some extent, I had internalized Carter’s plea for a different measure of hit tool by now—instead of projecting out batting average to determine a prospect’s “hit” capability, the prospect staff here takes a more granular, sum-of-all-parts approach. In most cases, we will assign individual grades to a hitter’s bat-to-ball skill, their strikeout avoidance, their barrel dexterity to all four quadrants, their swing decisions, and their launch/spray distribution, then weigh each variable in context with the others through both video and stat work. There are individual statistical indicators that marry well to each of those skills; In-zone contact rate (Z-Con%), and hittable pitch take% have strong correlations with K avoidance if you want to dig into the reasons for the walk back to the dugout. Heat maps with HardHit% broken out by zone often tout barrel dexterity where video work falls short. SEAGER and Z-O Swing% illustrate swing decisions similarly. Z-Con% is generally understood as a dominant measure for hit tool evaluation—it’s one of the most pervasive bits of information disseminated about hitting prospects. I myself have used it that way for years now. But why?
We don’t care as much as we used to about projecting out batting average based on any hitter’s current underlying skills; we understand now that batting average is not as complete a picture of hitter value as, say, wOBA, wRC+, or DRC+. In fantasy baseball, sure, average can be very important. But just to illustrate the issues with using Z-Con% the way we have, a player’s zone contact rate has a relatively weak weighted correlation to even batting average itself—only 0.27 among hitters with 200+ PA from 2021-2023 and 0.23 with next year’s batting average, indicating a weak linear relationship between the two variables. As another example, standard deviation of launch angle (sdLA), which measures the mean variance in degrees for each of a hitter’s batted ball launch distribution, correlates to batting average at a -0.38 rate. This number is negative, indicating that as standard distributions get larger (and launch angles more inconsistent), batting averages decrease globally. It’s an imperfect measure. It also boasts a stronger correlation with batting average than Z-Con% does. Why don’t we emphasize it nearly as much as we do Z-Con%?
To talk about my follies with Z-Con%, we need to talk a little bit about exit velocity’s role in modern evaluation. Bear with me; it’s an illustrative parallel, until it isn’t. Maximum and 90th-percentile exit velocities are extremely helpful indicators (over a large enough sample) for any given player’s achievable power. If you want, you can stratify exit velocity permutations across the global spectrum to arrive at a range that provides an insightful gradient for power grades, as outlined by this Baseball America article from February. Both contact and EV exist within a similarly sized range. Most major leaguers vacillate between 75% and 95% for their zone contact rate. Most hitters are within a ~15 mph range in my chosen exit velocity permutations. A figure at the middle of the Z-Con% spectrum and a figure at the middle of the exit velocity spectrum should both meaningfully signal average grades for their respective tools, right?
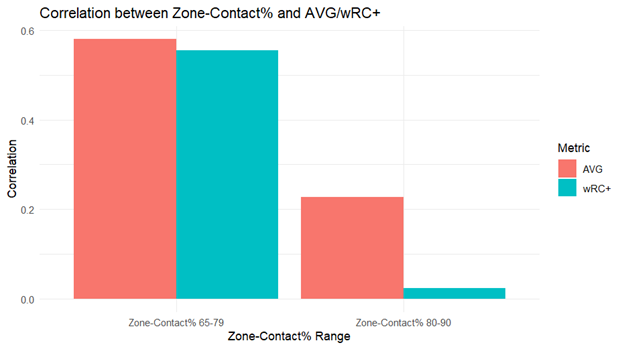
Here’s where I get to the crux of why I’ve been thinking about this metric incorrectly. I have been mapping it into stratified buckets, like I do for 90th-percentile exit velocity readouts. An 82% zone contact rate, a full standard deviation below the median big leaguer, must meaningfully signal a 40-ish hit tool, and should be weighted as such, just as a 101 mph EV90 does for power. Except that it doesn’t—at least, not to the same extent. Max EV and EV90 both have moderate or better correlations to ISO and next-year ISO (EV90, in particular, boasts a .5 or better r-value with both next-year ISO and next-year xwOBA, which is why we’ve all gravitated towards using it). Here’s a diagram showing the correlative strength of Z-Con% with offensive production among batters with at least 200 PA in 2024:

As you can see, Z-Con% keeps correlative pace with its exit velocity counterparts up until a point. However, Z-Con% becomes far less meaningful as it approaches the big league average of 84.3%. As the graph indicates, by the time you get close to that mean figure, each additional point increase of Z-Con% has a relatively weak linear relationship to batting average, and a negligible relationship to wRC+. In other words, zone contact is a shelf statistic, with diminishing marginal returns right when you approach the league average. The difference between 71% and 79% might mean the world for a big leaguer’s viability, but the same eight-point differential between 80% and 88% sees a stark reduction in significance. This is the sweet spot where all of the other inputs for hit tool evaluation should be granted more weight. By treating in-zone contact as a shelf, a benchmark to hit, not as a range to dissect the way we do with exit velocities, we can dig in further to the ancillary descriptors, thereby arriving at more precise hit tool evaluations.
*Thanks to Robert Orr (@NotTheBobbyOrr) for his mostly unwitting help, and his app that provides correlation values for various stats from 2021-2023.
Thank you for reading
This is a free article. If you enjoyed it, consider subscribing to Baseball Prospectus. Subscriptions support ongoing public baseball research and analysis in an increasingly proprietary environment.
Subscribe now